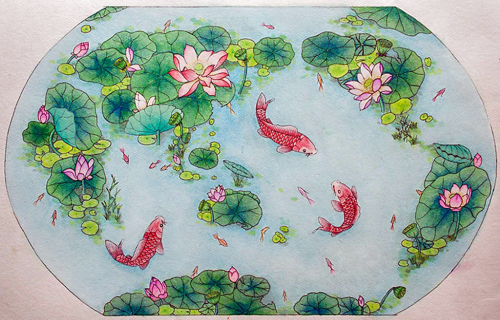
MapCarte 370/365: A world of lotus, a world of harmony by Liao Zhi Yuan, 2015

MapCarte370_yuan

Cartography has always been, in part, an artistic pursuit and in a world where many more maps are now made digitally we see a lot of bland cartography in design terms. Still, hand drawn maps inspire and have something very human about them. The marks of the pen and the shades of the colouring give the map character. Of course, when we’re growing up we routinely draw with pen and paper and the recent entries to the International Cartographic Association’s Barbara Petchenik children’s map competition evidence the imagination and artistry among the world’s youngsters.

This beautiful map from 15 year old Liao Zhi Yuan of China typifies not only a high level of artistry but also in interpretation and use of the map form. Pictorial maps often make heavy use of non-map imagery or combine elements to make up a map form. Here, the use of the aquatic lotus flower, reflecting cultural significance, forms the shape of the landmasses of the world map within an ornamental pond. It’s a simple yet effective idea that communicates a message of harmony using established symbolic visual metaphors. The map itself is a lovely piece of cartographic art and well drawn.

Of course, we don’t all have to have an artistic talent to make maps but if you’re going to make maps like these it certainly helps. It should also act more generally as an inspiration to think creatively and to aspire to make maps that are set apart from the rest.

MapCarte 330/365: The island of Philip Gonzalvez by Philip Gonzalvez, c.1985

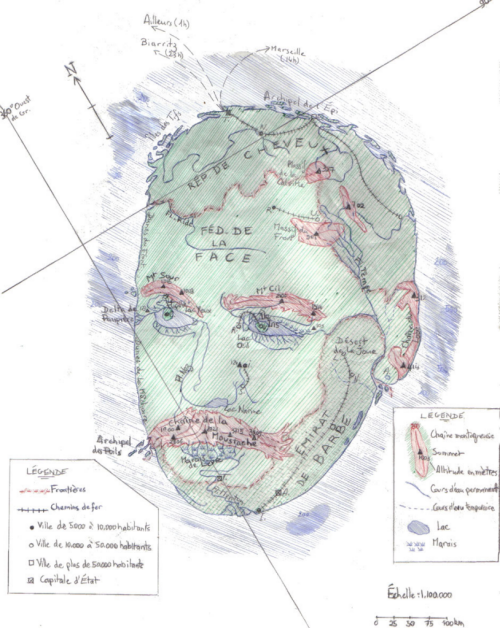
MapCarte330_gonzalvezIt’s probably possible to make a map of just about anything and that includes the human form. The natural undulations and features of the body provide a rich terrain for people to let their cartographic juices loose on. Philip Gonzalvez did just that in this map of his face. In what has been referred to as ego-cartography, this map describes his facial features using map symbol metaphors.

The face is an island, strangely detached from its body but the usual green for land and blue for surrounding water provides the clear story that we’re looking at a man as an island. Prominent features are symbolised in a different colour to connotate elevation and a change in terrain with many other standard cartographic representations used to show discrete facial features such as the hairline as a border, eyes and nostrils as lakes and there’s even spot heights shown (and bathymetric depth noted). The République de Cheveux (Hair Republic) sits on the border of part of the Fleuve Ride (Wrinkle River), with the Fédération de la Face (Federation of the Face) beyond. There’s ports and ferry routes as well as all the usual map marginalia such as a graticule, north arrow, legend, border and scale, as both a representative fraction and scale bar.

The map even offers a cartographic joke as the meridian line dissecting the island is at 360 degrees west of GR. (Greenwich) which given that longitude is split into 360 degrees would place the map exactly back at Greenwich.

It’s whimsical and hand drawn. There’s nothing particularly exact but as an artistic representation, in map form, it clearly illustrates that map’s can be made of anything. As ubiquitous and recognisable objects, drawing another object in the style of a map doesn’t present a major challenge to the viewer…though perhaps intrigue and a fascination for how the artist has encoded their unique geography does.

MapCarte 316/365: Ocean Chart by Henry Holiday, 1874

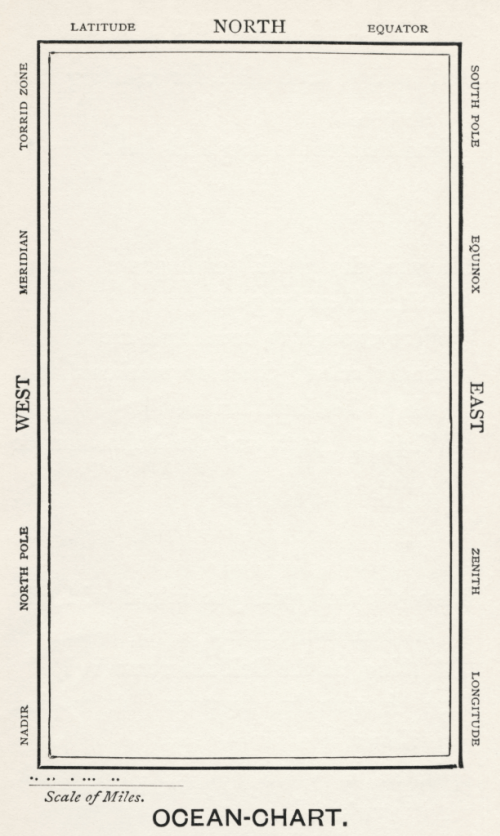
MapCarte316_snarkThe old adage less is more is a mantra of map design. While adding detail to show complexity is important, particularly in thematic or statistical cartography, it’s often possible to achieve it through a minimalist approach. For topographic mapping, the white spaces no longer suggest a lack of knowledge that needs filling with strange mythical creatures, but a graphical brevity. Being overly ornate detracts from the message of a map and beautiful, aesthetically pleasing maps are often those that appear quite stark at first glance. This map is possibly the most stark of the lot…a humorous take on large scale mapping at a scale of 1:1 accompanying the famous Lewis Carroll nonsense poem The Hunting of the Snark (An Agony in 8 Fits).

The plot of the poem is of ten crew on a tall ship hunting the Snark yet it’s been interpreted to have many meanings. The poem was illustrated by Henry Holliday who also drafted the Ocean Chart map to accompanycomments in the poem itself that can be easily interpreted as a commentary on the problems of maps and map interpretation:

He had bought a large map representing the sea,
Without the least vestige of land:
And the crew were much pleased when they found it to be
A map they could all understand.

“What’s the good of Mercator’s North Poles and Equators,
Tropics, Zones, and Meridian Lines?” 
So the Bellman would cry: and the crew would reply
“They are merely conventional signs!

“Other maps are such shapes, with their islands and capes!
But we’ve got our brave Captain to thank: 
(So the crew would protest) “that he’s bought us the best—
A perfect and absolute blank!”

The poem alludes to problems of interpreting complex maps and that the poor crew, who lacked the ability to read a map were delighted to see that the ocean chart, being blank, was perfectly understandable and represented the vast emptiness of the ocean perfectly. That said, the surrounding random map and associated terms are haphazardly arranged to cause maximum confusion, regardless of which orientation in which the map is held.

It’s difficult to argue with the accuracy and clarity of the map. More seriously, it reminds us of the need for accuracy, meeting our user’s abilities in interpretation, not getting overly caught up in convention when a more appropriate approach may be useful, and also the need to use white space wisely.

MapCarte 296/365: View of the World from 9th Avenue by Saul Steinberg, 1976

MapCarte296_newyorker

Maps make very evocative and attractive covers for books, magazines and pretty much anything! Done well, they can add a sense of place to say something of the content within. Their composition, density of detail, colours and style often speaks to the audience and will go a large way to attract them to the product. They can be overt marketing tools or they can simply be pleasing on the eye and only later become remembered as something rather unique.

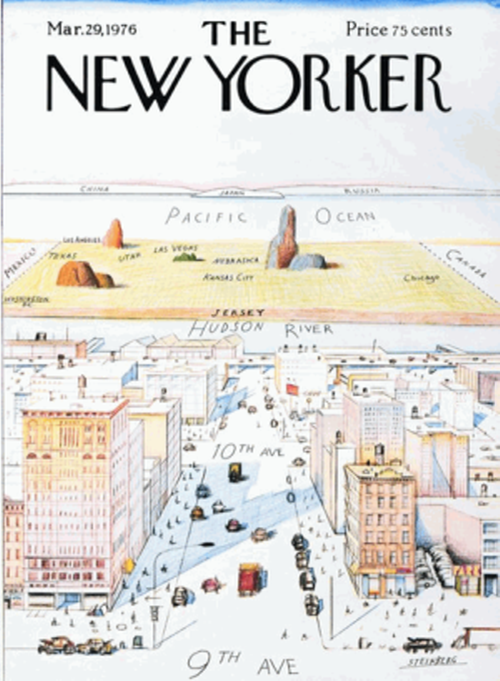
This 1976 cover of The New Yorker is probably instantly recognisable because it holds this special status as a widely viewed ‘classic’ magazine cover. Drawn by Saul Steinberg, the drawing shows the view of the rest of the world from Manhattan (or perhaps an outsiders’ view of New Yorkers’ self image). Unremarkable? Not really. Here is a statement of Manhattan being seen as the centre of the world. It suggests this is the view of the world shared by New Yorkers who know the detail of the centre of their city, just about get to the Hudson River and then see nothing but a vast, rather empty Jersey beyond which is nothing except the Pacific Ocean and China, Japan and Russia on the horizon.

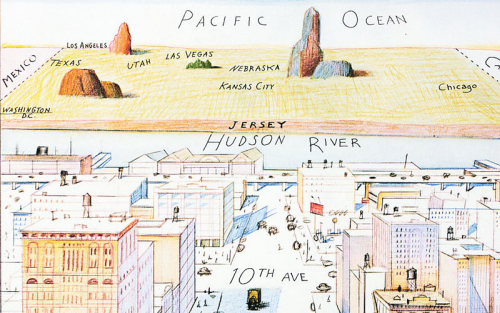
MapCarte296_newyorker_detailIt’s a wonderful illustration that mixes architectural clean lines with typeography that seems an afterthought yet helps the sense of perspective. Steinberg drew many covers and illustrations for The New Yorker of which this is by far the most famous. The proportions of the page used for Manhattan vs the rest of the world and the width of the Hudson River compared with the Pacific are not accidental. The rest of the world is shown about the size of three city blocks. The Pacific is narrower than the Hudson. The ‘Jersey’ label is shown in bold compared to the rest of the labels beyond the river. These are very deliberate design decisions that reinforce the overall message. They are subtle ways in which as an artist Steinberg can shape the way people view the map and form their image.

This is also how cartographers can shape their work with subtle modifications to the design, placement and style of map elements that promote, demote and reinforce a message.


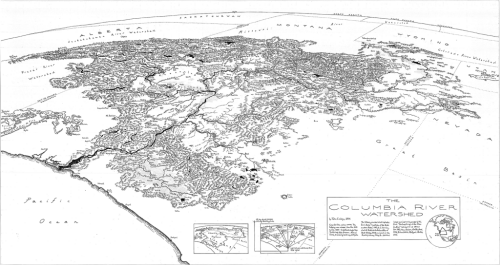
MapCarte 281/365: Columbia River watershed by Jake Coolidge, 2014

MapCarte281_columbia


Maps are usually bounded by arbitrary administrative constructs because we readily identify with them…countries, states, counties. They may otherwise use a graphical boundary defined by, say, chosen lines on a graticule. There are many other ways to define the boundary and, therefore, the focus of the content for a map which can resonate and serve your map better. Here, Jake Coolidge focuses on the Columbia River watershed but instead of making a map of the 7 states and parts of Canada its water originates from as a framework for the map, he’s used the watershed itself.

Once seen this may seem an obvious approach but it’s all too easy to rely on digital data which comes pre-packaged and organised. Simple selection queries perhaps don’t go as far as might be needed. Coolidge’s map is hand drawn though and the benefit of starting with a blank canvas means less reliance on other data. Choices can be more sensibly made.

The map focuses on the rich and varied terrain that makes up the watershed. The curved perspective view from space gives us a sense of the size and reach that a planimetric approach wouldn’t similarly achieve. Indeed, the simple act of adding exaggerated curvature and an horizon makes an impressive statement.

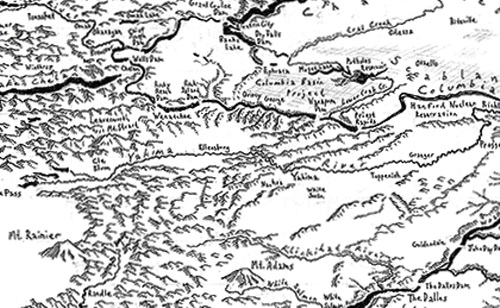
MapCarte281_columbia_detailThe depiction of features is carefully applied with each getting equal and detailed attention. The text sits comfortably in the landscape and the two components work well together. The lack of colour serves the map well too. There’s no distractions from the raw landscape and the sense of scale and scope is perhaps enhanced by taking the approach of making the map in monochrome with pencil and ink.

There is a benefit of taking a hand-drawn approach to map-making that Coolidge’s map also demonstrates. It takes time to make such a map and that time is demonstrated across the entire map in the detail of each decision to make a mark. While analytical techniques bring us speed, uniformity and allow those with less artistic abilities to make great maps, the time it takes to craft something by hand teaches the map-maker valuable skills as they wrestle with the various decision-making processes of map design. The product is a rich and beautiful map.

You can view a larger version of the map at Coolidge’s web site here or in the NACIS Atlas of Design Volume II in which the map is featured.


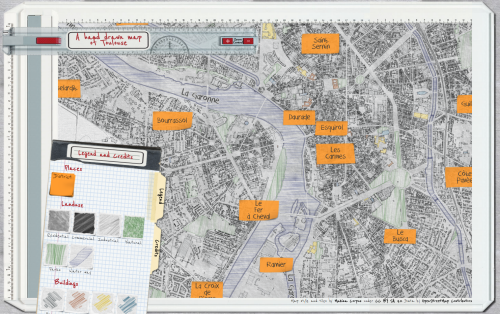
MapCarte 270/365: A hand drawn map of Toulouse by Karl Azémar, 2014

MapCarte270_toulouse

Click the image to view web map

There’s a growing trend in contemporary cartography that is supporting the ability for easy and rapid re-styling of OpenStreetMap data. It’s a mapping equivalent of paint by numbers and we’ve featured one or two on MapCarte (e.g. Stamen’s Watercolor in MapCarte108 or Space Station Earth by Eleanor Lutz MapCarte 236). How long the current interest can sustain cartography is questionable because ultimately it’s someone else’s base data and the only outcome is a map of basic topographic detail, styled in a particular way. What purpose infinitely re-styled maps has is still open to question though they are giving people the ability to stretch their digital creative juices.

This example by Karl Azémar goes a step further than most as he creates a framework for the map by making it appear in a window with a border that suggests an draughtsman’s drawing table. The sliding ruler is a nice touch as it also holds the controls for zooming. The legend and credits panel is moveable and the map is well drawn…literally. The hand drawn pencil and coloured pencil effect is well developed using different line treatments and shaded fills akin to the sort of map one used to create in a geography workbook.

What lifts this map above similar pencil styled maps is the way Azémar has considered not only the layout of the entire map window but also the content that includes a treatment for the names using Post-It notes. It’s a good way to handle labels on this sort of map and he even uses different colours to denote different categories of city. There’s a lot of good cartographic hierarchy in this map.

You can read more about how the map was made here.

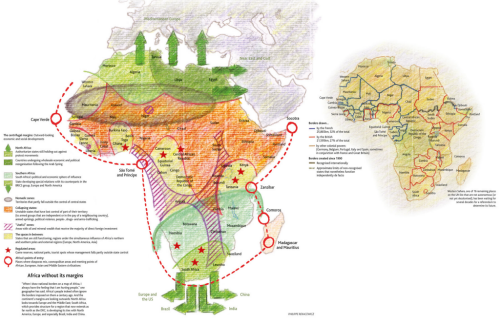
MapCarte 234/365: Africa without its margins by Philippe Rekacewicz, 2012

MapCarte234_africa

Newspaper maps often showcase the very best of graphic design since graphic design is one of the cornerstones of producing a well prepared publication. The ability to combine text, photographs and illustrations across a pleasing layout not only develops a house style but a sense of character that readers identify with. Maps are part of this style and Le Monde have consistently produced high quality graphics whether it be a small, simple location map or a more detailed piece that conveys a richer story.

Le Monde maps do not always follow the same graphic approach yet they are all expertly produced. This example from Philippe Rekacewicz takes a hand-drawn approach. It looks like a sketch map but the content of the map demands a fuzziness. Mapping Africa without borders means a map with very uncertain areas. The hand-drawn approach is endearing and lends itself well to this uncertainty. You easily forgive the lack of accuracy of the lines and demarcation simply because of the graphical approach. The colouring in is as you would expect from a set of colouring pencils with pencil coastline and the hint of erased and redrawn elements.

The smaller map depicts how the real borders were drawn by the French, British and other colonial powers but it’s the larger map with it’s borders indicative of mineral belts, nomadic zones and the spaces in between that’s particularly alluring.

Newspaper maps often show us how one-off cartographic products should be produced. Le Monde produces some of the best and although we’ve selected one example here it’s worth perusing their gallery here.

MapCarte 232/365: Atlas de Cuba by Garardo Canet and Erwin Raisz, 1949

MapCarte232_cuba


Atlases are designed to set out a social, economic, cultural and physical history of a place. They provide a slice in time that explains a country or a region and are often out-of-date fairly rapidly due to changing circumstances. It’s an inevitable problem for many atlas producers that as soon as one edition is published, work on the next begins in earnest. Of course, that also brings rewards since we can amass a collection of atlases that together paint the changing picture and, as cartographers, show us the changes and altering style of map-making and representation.

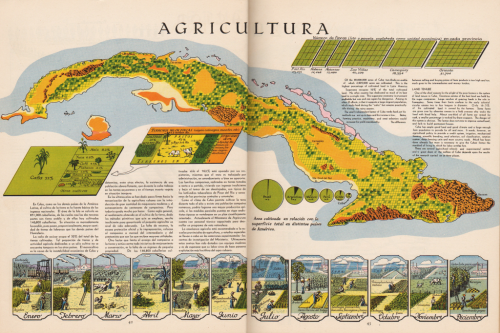
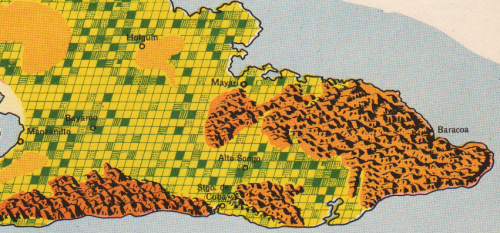
The Atlas de Cuba by Canet and Raisz was a little different. It attempted to paint a living picture of Cuba…literally given the hand drawn beauty of the work. They set out to explore problems and how these might manifest as well as what the solutions may be. Raisz’s work is evident. His maps are bold in use of colour and graphically rich as they combine beautiful landform mapping with innovative thematics. The page illustrated here, on agriculture, is typical of the maps. Relief is depicted in oblique ‘molehill’ style and the land use is laid out in a regular grid to create a patchwork of statistical information on the different crops. Simple blocks of complimentary colours give us a clear indication of the crops and the page is adorned with other graphs, legends and illustrations to bring the work to life.

MapCarte232_cuba_detail


There’s a simplicity in the work of this atlas that belies the effort it takes to make such maps. Keeping things simple is a mainstay of cartography but actually being able to achieve it and bring a subject to life is no simple task. To get it right across an entire atlas is an even more impressive achievement.

You can see many more illustrations from the atlas on John Krygier’s blog here.

MapCarte 224/365: Bangkok by Nancy Chandler, 1974-present

MapCarte224_bangkok2


Tourist guides are essential travel companions to help us navigate the unfamiliar.  We trust them implicitly to give us sage advice, to identify the key places to visit in an often constrained amount of time and to present a city or region in a way that supports our quest for discovery. In many ways they represent the view of a place that we perceive rather than the place itself because it’s such a strong filter. It’s also a difficult job for a cartographer to determine what to include or exclude because they’re effectively making choices that thousands and more will follow blindly.

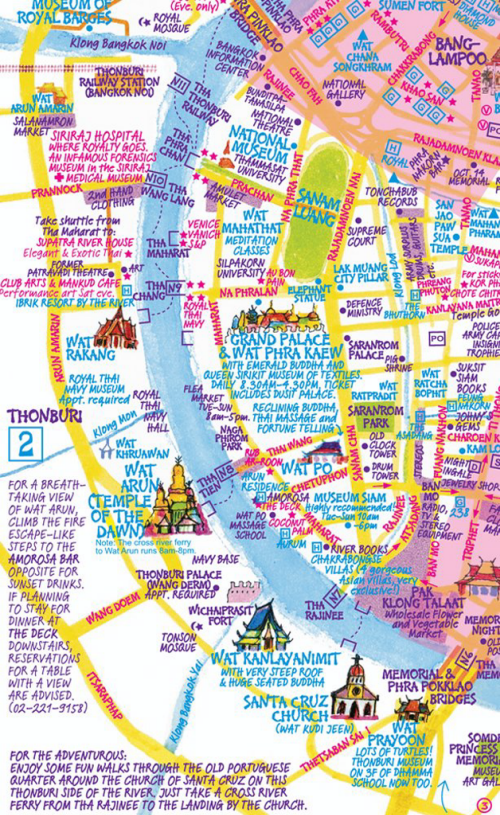
The best maps and guides become well known for their accuracy and utility and the more a product is revered the more we trust it. This applies to Nancy Chandler’s maps of Bangkok. They are unique. They don’t necessarily give you the top attractions but that is entirely the point. Since the first edition in 1974 right up to the current 26th edition they provide a rich window on the quirky and unique places to eat, drink and visit. And they do it in style with a fantastic colour scheme and hand drawn approach. The colours give the map a unique aesthetic that somehow captures the hustle and bustle of Bangkok. They make the map sing and dance and give the reader a sense of colour, vibrancy and excitement. In support of a product for tourists this is great cartography.


MapCarte224_bangkok1

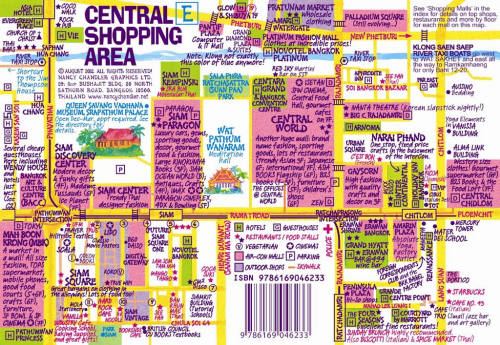
The double-sided map splits Bangkok into sections and the central shopping areas. The information is detailed on all sorts of museums, restaurants, hotels, galleries, temples and many other features. There’s copious text which acts to annotate locations. Without the text there would be a great deal of white space but that simply evidences the judicious editing and careful selection of the content. This map highlights a very personal geography but one that many people identify with. The map has become a staple companion for countless people who visit and has become part of the excitement of the city itself.

Making a tourist map that becomes part of the enjoyment of the tourist experience itself is an achievement. This map certainly holds a special place for visitors to Bangkok.

You can see more of Chandler’s work and other maps at her web site here.

MapCarte 223/365: Mammoth Mountain by James Niehues, 2008

MapCarte223_niehues


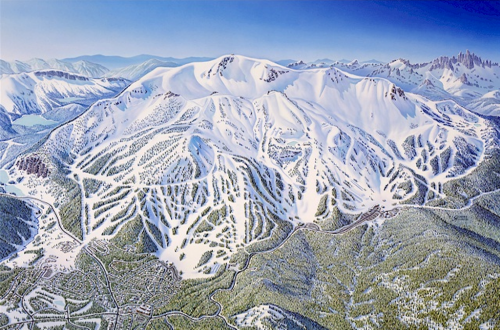
The basis of many outdoor recreational maps is a good topographic map. If the recreation makes use of a mountain and it involves descending the slopes whether by ski, snowboard or mountain bike then the interest is in the mountainsides and a planimetric map just doesn’t provide the right aspect. Most ski trail maps show the mountain in aspect or as an oblique image so we see the trails running from top to bottom down the map itself. One of the big problems in making maps of this type is how to fit trails that descend in different orientations down a map so they are all shown equally well.

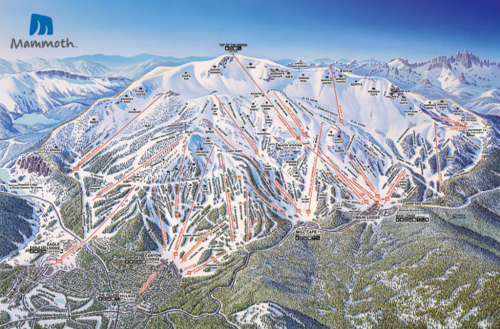
Many landscape painters and artists have been involved in drawing and painting panoramas that support ski trail mapping for decades. James Niehues has painted many of North America’s resorts and mountains as well as many overseas locations. His unique approach involves aerial surveys followed by a drawing that warps the landscape to rotate the trails toward the front. It’s a form of exaggeration and displacement, long held generalization techniques but here applied to a painted landscape. His final painting in exquisite detail and rich colours is a beautiful object in its own right. Here, his painting of Mammoth Mountain in northern California shows the volcanic peak as the key feature with a good deal of artistic license but nothing that isn’t unrecognisable or topologically incorrect. It still supports on mountain navigation perfectly. His trees are particularly impressive, each one placed and painted individually and the townscape, horizon, haze and skies add to the drama and beauty.

MapCarte223_mammothOnce the skit resort has added their lift lines and trail markings to designate difficulty, the map takes on a more functional purpose but the painting and geometric symbols that overlay work in harmony. Text is applied to name different features and runs and the map has not only form but function.

Painted panoramas give us a beautiful way of seeing a landscape. They also provide the backbone and a perfect canvas for this very specific type of recreational map. Niehues’ work sits at the peak of ski resort panorama mapping.

You can see much more of James Niehues’ work on his web site here.