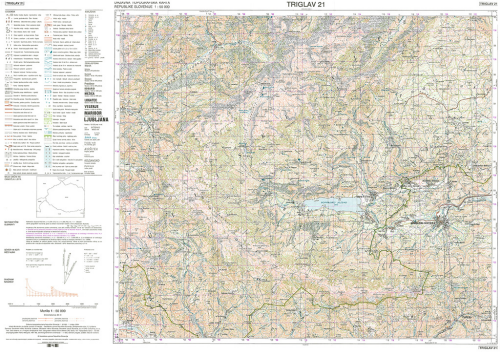
MapCarte 352/365: 1:50,000 Topographic Map No.21, Triglav, Slovenia by Surveying and Mapping Authority of the Republic of Slovenia, 2004

MapCarte352_sloveniaState topographic maps have a special relationship with the national landscape they are designed to symbolise and offer much more than a dry statement of facts and approach a kaleidoscopic fusion of art, science and culture. And far from being standardised, topographic mapping (especially in Europe) exhibits a wide diversity of cartographic styles, according to how the national landscape is to be used, valued, and preserved. As with any map, topographic maps are subject to the key decisions in mapmaking – choices over what to show and how to show it – and these choices can be slow to change. So what happens when a new country is born?

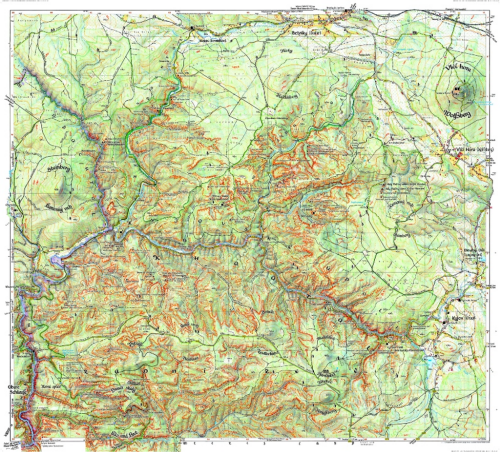
The central European nation-state of Slovenia achieved independence from the Socialist Federal Republic of Yugoslavia on 26th June 1991, joined NATO and the EU in 2004, and in 2007 became the first former communist country to join the Eurozone. Following independence, Slovenia established a comprehensive topographic mapping programme, with the new 1:25,000 series (comprising 198 sheets) being the first to completely cover the state territory in 1999, followed by the 1:50,000 series (58 sheets) which was completed in 2005. The map shown here is the sheet from the 1:50,000 series that includes Triglav, 2864 m, the highest mountain in Slovenia and highest peak of the Julian Alps, situated in the north-west of the country.

MapCarte352_slovenia_detailThe landscape of the new country was captured and defined using a new cartographic language. Under the old regime, topographic maps were available only to certain users, and omitted key aspects of the landscape such as caves and depressions – key features of the Karst landscape that covers much of the country. These features now take their rightful place in the landscapes of the new and fully accessible series of topographic maps. The extraordinarily rich symbology – with over 200 graphically distinctive symbols in the 1:50,000 series – is broader than any other employed by a European national mapping agency at this scale. Here, the language of cartography is in full bloom.

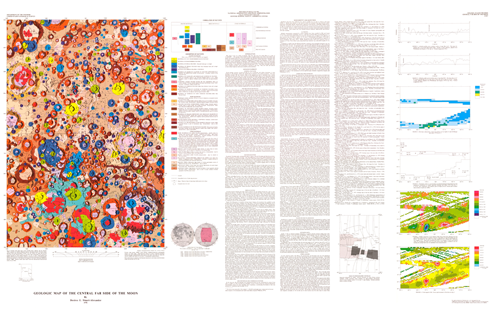
MapCarte 347/365: Geologic map of the central far side of the Moon by Desiree E. Stuart-Alexander, 1978

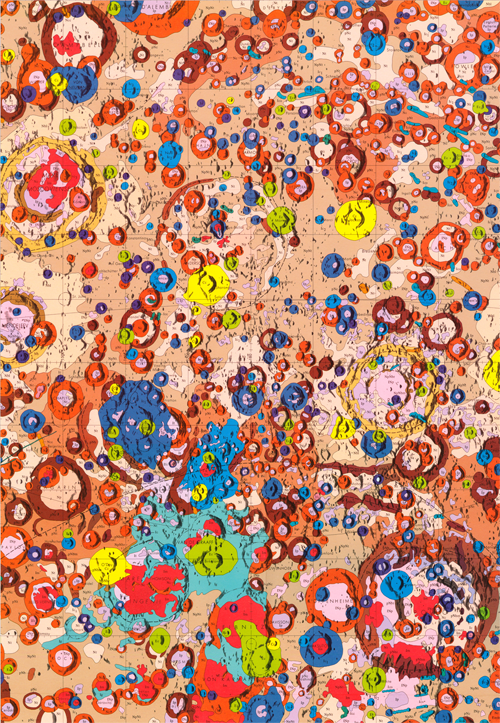
MapCarte347_moonCartography isn’t restricted to the planet that we inhabit. Imagery and maps have long been made for other planets, moons, stars and (recently) comets in our solar system and, indeed, of the solar system itself. They are a key mechanism by which we record information about the surface composition, geology or topography whether that be by remotely sensed imagery or through the capture and analysis of samples from human exploration or robotic means. Being the closest major celestial body to Earth, the Moon is perhaps unsurprisingly the earliest and most detailed to have been mapped to date.

Prepared for the National Aeronautics and Space Administration by U.S. Department of the Interior and U.S. Geological Survey as part of the Geologic Atlas of the Moon, 1:5,000,000, this map was the first of its kind.  It was compiled from NASA Lunar Orbiter and Apollo photographs and Soviet Zond photographs as well as geochemical and geophysical data obtained from orbiting spacecraft to show the detailed geological character of the Moon in glorious detail.

MapCarte347_moon_detail1The map illustrates the topography as a technicolour mosaic that is almost Jackson Pollock-esque in design.  The engaging palette of colours immediately attracts interest in the map which accentuates the strange form of the Lunar landscape.  What might appear to be a small design element, the thin black line outlining each feature helps to accentuate the image and delineate one feature from another as distinct forms in contrast to the monotonous appearance of the real landscape.  The colours themselves allow the reader to quickly differentiate between neighbouring detail and also to identify where similar information exists elsewhere. It’s also possible to pick out craters and other morphological detail.

MapCarte347_moon_detail2The map is in two versions, one that includes geological notation and grids and a version without. It’s a magnificent scientific tool of record and discovery but it’s also a piece of cartographic art and one which has inspired many subsequent maps of the moon and other bodies that generally comprise an interest in planetary cartography.

MapCarte 345/365: British Trench Map 57C.SW.1 (Gueudecourt) (1:10,000) from World War I by the War Office, 1916

MapCarte345_trenchMaps fight a good war. Geographic intelligence has always been a pre-requisite for battle, whether in the form of Ezekiel’s clay model of Jerusalem or a digital terrain model from a reconnaissance drone.

The year 2014 marks one hundred years since the outbreak of World War I, a global conflict which began on 28th July 1914 and ended on 11th November 1918 with a cost of 16 million lives and the downfall of four Empires in continental Europe. After the German army had invaded neutral Belgium and Luxembourg, their march on Paris was halted and what became the Western Front fell into a battle of attrition with a line of trenches that changed little until 1917.

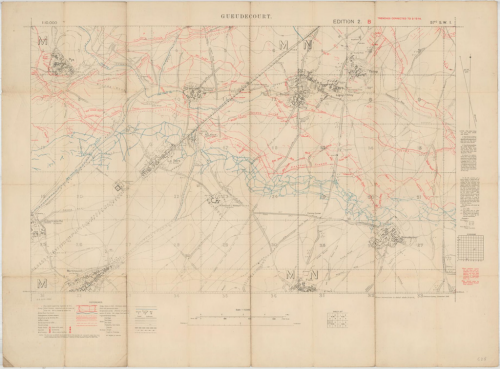
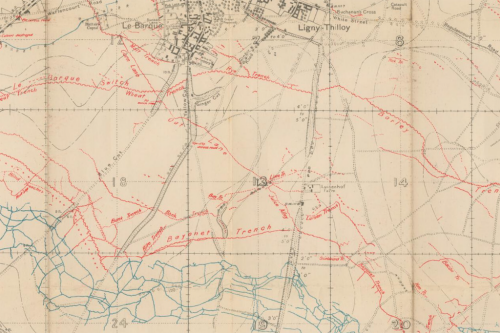
When the British Expeditionary Force (BEF) crossed the English Channel in August 1914, it relied upon on existing maps at 1:40,000 (Belgium) or 1:80,000 (France) and some at smaller scales, which were useful for planning troop movements, but not for the largely static war of attrition that required a more detailed knowledge of enemy defensive positions. From early 1915 the Geographical Section of the General Staff (GSGS) at the War Office began to produce new, larger-scale maps for the fighting units at the Front. At a scale of 1:10,000, the new maps could reveal details of the enemy Front Line, machine gun posts, bunkers, communication trenches to the rear and any defensive positions. Small teams of Royal Engineers and Ordnance Survey surveyors gradually grew into larger field survey companies who could correct, print and distribute maps from the British lines.

MapCarte345_trench_detailThe Battle of the Somme, fought by the British and French forces against Germany from 1st July to 18th November 1916, was one of the largest battles of the war and claimed over one million casualties. The 1:10,000 sheet shown here, Gueudecourt, depicts the trenches as on 2nd December 1916, with German positions in red and British/French in blue (as was the standard until these colours were reversed in early 1918). Gueudecourt was one of the most distant objectives of the British during the Battle of the Somme. The village saw decisive action from the Royal Newfoundland Regiment, who played a key role in capturing and successfully defending a German strong point. A memorial near the village, comprising a bronze caribou standing atop a cairn of Newfoundland granite, commemorates their achievement and sacrifice.

Images by permission of the National Library of Scotland

MapCarte 325/365: Mount Everest Expedition by Major Henry Morsehead, 1921

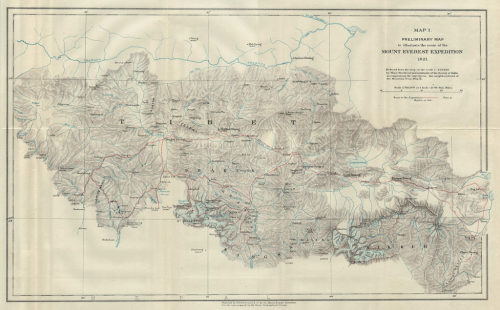
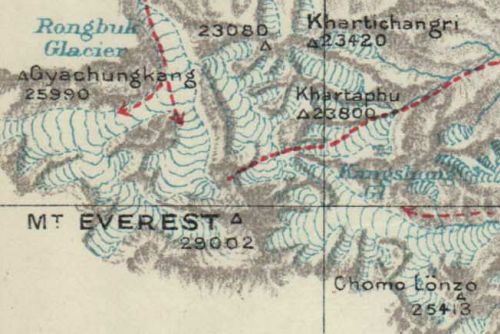
MapCarte325_morseheadThe Great Trigonometrical Survey of India in 1856 established Mount Everest (known as Peak XV) as 29,002 ft (8,840m). The survey itself was incredibly accurate compared to the modern height of 29,029ft (8,848m). It was named Mount Everest by the Royal Geographical Society upon recommendation by the British Surveyor General of India, Andrew Waugh, who named it after the man he succeeded, Sir George Everest. It was nearly 100 years later, in 1953, when Tenzing Norgay and Edmund Hillary made the first official ascent though debate continues to surround the possibility that George Mallory and Andrew Irvine may have reached the summit as part of the 1924 expedition. They made a final attempt on the summit on June 8th but disappeared in the clouds after being spotted high on the mountain. Mallory’s body was recovered in 1999 at a height of 26,755ft (8,155m). Surveys and maps of Everest were critical in the understanding of the mountainscape, the plotting of the various potential routes to the summit and the eventual success. The map made by Major Henry Morsehead as part of the 1921 expedition is arguably the finest early, detailed and complete map of the region.

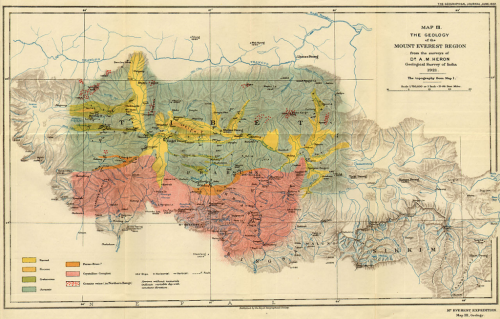
MapCarte325_morsehead_detailThe 1921 expedition was in effect a reconnaissance by the British who reached an elevation of 22,970ft (7,000m) on the North Col after a 300 mile march. Nepal didn’t allow foreigners into the country so the British expeditions had to approach the region from the Tibetan side. The map clearly illustrates the divide between nations in the limit of the detail, with Everest being shown on the south edge of the detailed map. The impressive detail is wonderfully rendered with hand drawn hillshading in grey to identify slope and aspect. Darker shading shows higher areas and ridges are shown as if illuminated vertically. Water and glacial features are shown in a light alpine blue hue with only one further colour, red, used to show the different routes through the region. The map is a work of art in relief portrayal and clarity and a result of more than simply marching to Everest itself. This map required Morsehead and his team to explore the entire region in harsh conditions. They weren’t alone in their map-making endeavours with others in the team also undertaking photographic surveys, collecting specimens of flora and assessing the geological structure. Indeed, Alexander Heron’s Geological map is also impressive in its own right.

MapCarte325_heronDespite initial thoughts of using the 1921 expedition for a full assault on the summit, the trip was eventually led as reconnaissance. Before they had left the region, the Royal Geographic Society’s Mount Everest Committee had already established a subsequent expedition for the following year to go for the summit. The 1922 expedition used Morsehead’s map to push on via the North Ridge route to an elevation of 27,300ft (8,320m) which was the first time a human had climbed above 8,000m. It was also the first attempt on Everest that used bottled oxygen to counter the effects of elevation. George Mallory, who had taken part in the 1921 expedition, had discovered a potential route to the summit though on the third attempt seven porters died in an avalanche and the expedition abandoned. They had established a new record climbing height but the lure of the summit would have to wait.

To date over 4,000 different climbers have made nearly 7,000 summits. Some 250 people have died trying to climb Everest. Today’s climbers take modern equipment and digital maps yet for its time and, still, Morsehead’s map retains its status as a cartographic gem that supported early attempts on the summit.


MapCarte 318/365: Cassini Carte de France by César-François Cassini de Thury, 1788

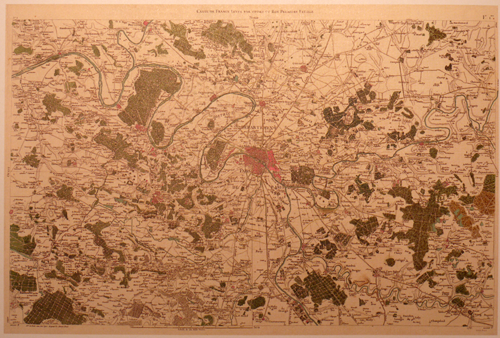
MapCarte318_cassiniMapping entire countries is not for the feint-hearted. In 1744, Cassini prepared the first systematic, nationwide survey of a nation state, France. He was later commissioned to produce a more detailed map series to ultimately consist of 180 separate map sheets. This was not the work of a year or even a decade of preparation. This feat was the culmination of a century’s work by three generations of the Cassini family. Monumental in design and scope, Cassini’s map series was the result of scientific survey based on the triangulation of France which began in 1669 by his ancestors. By 1678 the Paris region had been mapped at a scale of 1:86,400. Various wars and other campaigns meant that surveying the remainder of France didn’t truly get going until 1733 when Cassini (strictly, Cassini III) recommenced the survey. Cassini’s map of 1744 laid out the traingulation of France but it required further surveys to fill in the map with topographic detail.

The new topographic map series, also at a scale of 1:86,400 began in 1748. It encompassed an 18-year plan with 10 maps to be published per year. The first two maps in the series took 8 years to be prepared yet they became the first properly surveyed, planimetrically accurate maps of a country. The level of detail was astonishing for the time and out-shone previous cartographic efforts by other European map-making dynasties. These maps immediately elevated France to the pinnacle of European cartographic excellence.

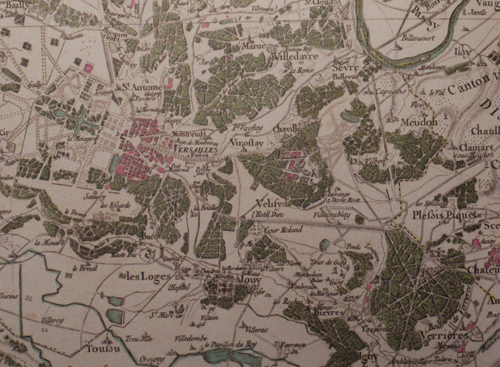
MapCarte318_cassinidetailThe map of Paris shown here was part of the second survey series. The detail and artistry is incomparable for the time. The use of colour highlights different land use types with a bright pink being used to show built up areas intersected by a generalized but highly detailed street network. Shadows are used throughout to emphasise different elements which raises them to create a pseudo-natural look and feel. This is particularly evident on the deep green forested areas which also contain a pattern fill. Topography is shown with shading and fine hachure abd shadows are also used to add depth to rivers, shown in blue. The typography is beautifully applied and pictorial symbols finish off the detail showing the positions of churches and other landmarks.

This is a key map in the history of cartographic design. Accurate and beautiful. Form and function.

MapCarte 315/365: Yu ji tu by Anon, c.1136

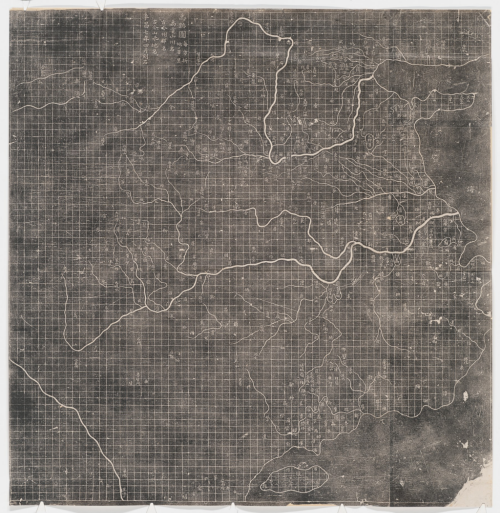
MapCarte315_yujituDesign excellence in a map may not be simply because it looks pretty or that one might suggest it has some sense of aesthetic value. In fact, this impression of beautiful cartography often irritates because design is about much more than how a map looks. It’s about getting the form correct, but in concert with the function. A pleasing map to look at will not necessarily be a well designed map. And so the converse is true. This map, dating back to the Chinese Song Dynasty (960-1279) and being made in c.1136 might not be considered particularly pleasing to look at. It is, however, perhaps the most important Chinese map ever produced.

MapCarte315_yujitu_detail

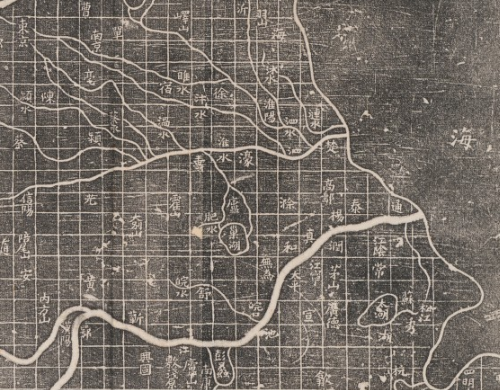
The title translates to ‘Maps of the Tracks of Yu’ (tu being Chinese for map) and is taken in honour of the Chinese ruler Yu the Great. The map, carved in stone, is remarkable in design terms for a number of reasons. Firstly, it’s depiction of the Chinese coastline is extremely accurate for a map of this size and scale. It measures 3ft square and the map’s most important contribution to cartography is that it was the first to use a grid to denote scale. There are approximately 5000 grid squares, each measuring 100 Chinese li (approx 30 miles) so the map is at a scale of approximately 1:4,500,000.

However, the claim of accuracy of topographic detail and scale belies another facet of the map in that it is used as a canvas upon which Chinese mythology is depicted. The origin of the Yellow river is given as sources named by Yu the Great and the legend mixes detail that acknowledges the past and present…meaning it’s part fact and part fiction.

On the face of it, a bland map carved in stone but it’s design is important in cartographic history.

MapCarte 312/365: Khaatal 1:10.000 by Rolf Böhm, 2012

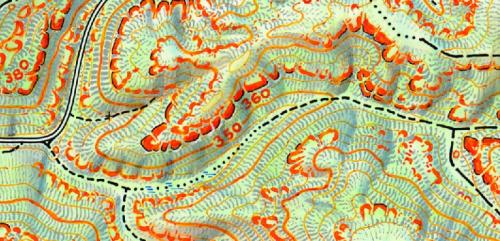
MapCarte312_bohmSpecial purpose maps demand special purpose design in order that the unique characteristics are brought to the fore. Maps that support hiking and orienteering need a very detailed visual description of the landscapeand terrain that goes beyond a standard topographic map. For instance, while contours are prominent on most topographic maps they tend to dominate rocky outcrops and small cliff-lines. Of course, knowing precisely where these dangerous areas are is critical to avoid a serious mistake. This map, designed by Rolf Böhm brings a beautiful aesthetic to a map to support outdoor pursuits.

The map of Khaatal covers a popular hiking and climbing area south-east of Dresden in Saxony, Germany. Böhm, a passionate cartographer and hiker, depicts the unique natural character of the rock formations along the Elbe river with clarity.  His process of making the map illustrates the care and attention to detail required for the final product. All in all the map is drawn 3 times – first of all there is the work in the terrain taking notes and making sketches, then the map is fine-drawn in hand at the desk on a white sheet of paper and finally it is finished using a computer.

MapCarte312_bohm_detail

The result is a map that attracts users with its artistic depiction of the unique landscape of Saxon Switzerland. The lively representation of the terrain consists not only of contour lines and hand-drawn hillshading (applied using watercolours) but is accompanied by an artistic depiction of the sandstone pinnacles which are classified by their height. Besides rock hachures indicate the direction and steepness of the rock formations…and all in a rich red that allows them to stand out and contrast with other map detail.

The choice of type style for the map lettering supports the impression of a traditional hand-drawn map. Nevertheless, the map provides high accuracy and rich up-to-date information for hikers and climbers.

You can see more of the map and the detailed process of its construction at Böhm’s web site here.


MapCarte 295/365: 7.5 minute Quadrangle sheets by USGS, 1945-1992

MapCarte295_quad7_5

National Mapping Authority topographic map series have been the bread and butter of many nations. Each has developed a unique style and brought a particular sense of design to their map sheets. Many of us have grown up with a love of our own national maps having used them in school and on holidays. They become familiar and known. We understand the symbology, the scales and the look and feel they bring to our understanding and appreciation of the environment. We featured one such mapping series by Great Britain’s NMA, Ordnance Survey, in MapCarte 30. Here we focus on the famous quadrangle maps from the United States, specifically the large-scale 7.5 minute series.

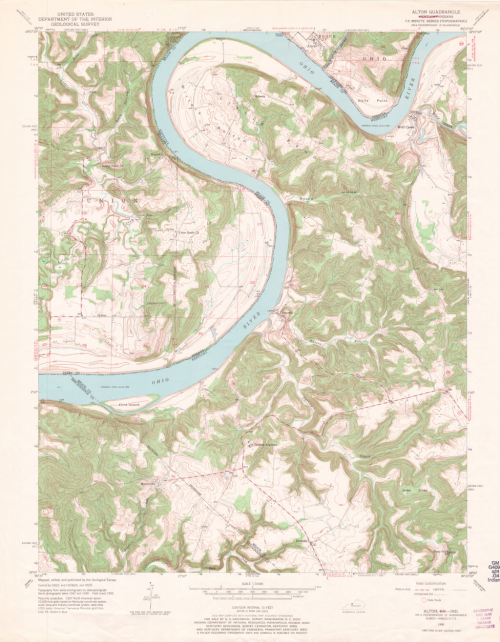
The United States Geological Survey (USGS) largest (in terms of scale and quantity) and best-known map series is the 7.5-minute or 1:24,000 quadrangle series.  The scale is unique in national mapping being related to the measurement of 1 inch to 2000 feet.  Each of nearly 57,000 maps is bounded by two lines of latitude and longitude covering 64 square miles in southern latitudes but, due to convergence of meridians, only 49 square miles in northern latitudes.  The specification has been applied to many other geographies that the US mapped during military operations which demonstrates a high level of flexibility and versatility in the design.


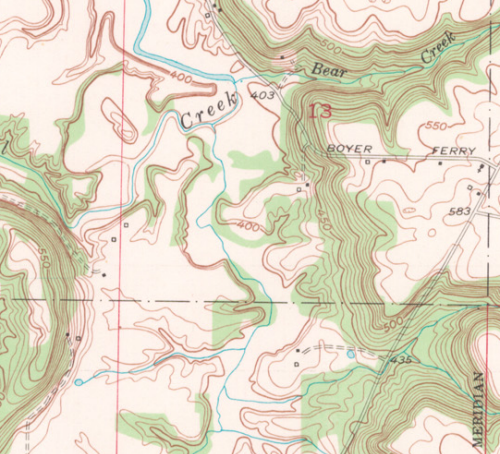
The example we show here is the Alton Quadrangle (195) that covers part of the Ohio River on the Indiana/Kentucky border. It shows the balanced composition of the sheets perfectly as it encompases considerable elevation change depicted with the signature orange-brown contours as well as the forestry and water bodies.

MapCarte295_quad7_5_detailAs a brand, the series is instantly recognizable and successful.  The content serves both civilian and military purposes and supports varied usage.  Marginalia is well structured and complex information delivered in a succinct, well organised manner.  The series was officially completed in 1992 and while The National Map (http://nationalmap.gov/ustopo/) represents a new generation of digital products the impact of the originals persists with new maps arranged in the 7.5-minute quadrangle format as well as retaining the same look and feel.
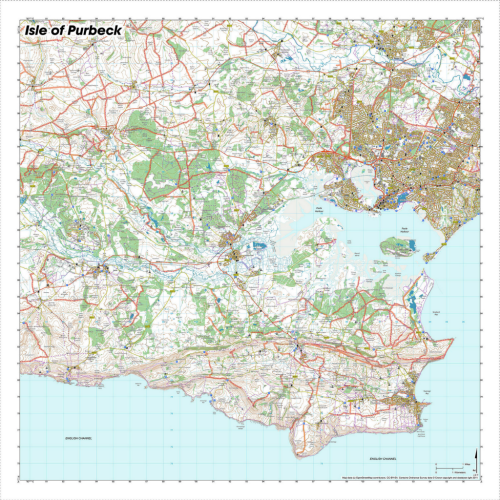
MapCarte 291/365: SplashMaps by David Overton, 2012

MapCarte291_splashmaps

Wearables are currently the supposed next big thing in technology. Every self-respecting tech-company is rapidly prototyping and releasing glasses, watches and all manner of products that offer us ways to measure, log and track everything we do. We can’t stop this sort of progress and at some point someone will work out the benefit of all this wearable technology but until then, we can simply reflect on a different type of wearable…the map.

Frustrated by inaccurate GPS devices and the obvious problem of paper maps getting wet, David Overton set about creating a product, using Kickstarter funding, that is a simple yet ingenious design – a map printed on an indestructable material. The design here is to create the product in a form that supports the function. Traditional map products have never developed with outdoor use in mind and suffer the insults of wind, rain and mud…as do electronic navigation devices (which additionally suffer battery drainage and screen glare). overton’s absurdly simple idea marries the engineering of a product that works well in the outdoor environment, based on data that can be licensed or sourced easily, and printed with modern technologies that maintain clarity.

MapCarte291_splashmaps_detail

The maps over 34 different areas of Great Britain (at the time of writing) and there is also a personalised service. they are waterproof, tearproof and can withstand being handled roughly. They can also be written on and are washable so after getting the map in a mess it can be thrown in the washing machine and be brought back to its pristine best.


MapCarte291_splashmaps_detail2The idea of printing maps onto fabric is perhaps not a new one but this product certainly is. It’s design sits at the perfect confluence of form and function, delivering modern mapping to the outdoor enthusiast in a way that supports their activities 100%. Since coming to market SplashMaps have won a number of awards for both innovation and cartography.

More details at the SplashMaps web site here.


MapCarte 290/365: Map of the Island of Peurto Rico by Alvarado Dominguez, 1935

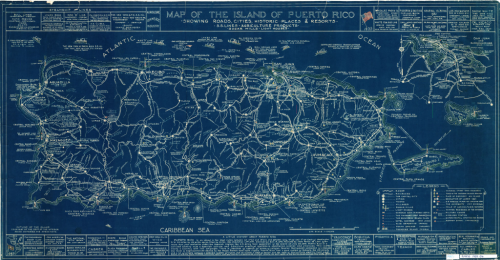
MapCarte290_peurtoricoThe aesthetics of a map usually have much to do with the relationship of form and function. Those that combine elements coherently, harmoniously and with purpose might be said to be displaying graphical eloquence. Then there are the maps whose form is so arresting that it trancends the function…or at least overrides it. This map by Dominguez from 1935 might fall into this category. The content is fairly typical of a medium-small scale product showng topographic detail of Peurto Rico. It’s a well crafted map in these terms but it’s the look and feel of the map that draws attention.

If you look at the map and think ‘blueprint’ you’d be correct. The map has been printed using cyanotype, a photographic printing process which creates the classic cyan-blue image we normally associate with architectural drawings – blueprints. The process was used extensively in the early 20th century because it was a low cost method of producing copies using chemicals that, when reacted as part of the photo-mechanical process produce an insoluble blue dye. The traditional blueprint is, effectively, a negative image with the brighter areas being those exposed and resulting in the linework and lettering.

MapCarte290_peurtorico_detail

Additional colours are added by hand but as a way of creating multiple copies of a map it provided an effective solution. In design terms, the authors had to be careful to ensure detail was of a suitable density since the map was effectively two colour and all linework and text sharing the same light tone. Different thicknesses of linework gives the map its visual heirarchy.

The look and feel of the map is one that immediately invites inspection and generates interest. A practical approach to managing costs but which creates an entirely unique map.