MapCarte 316/365: Ocean Chart by Henry Holiday, 1874

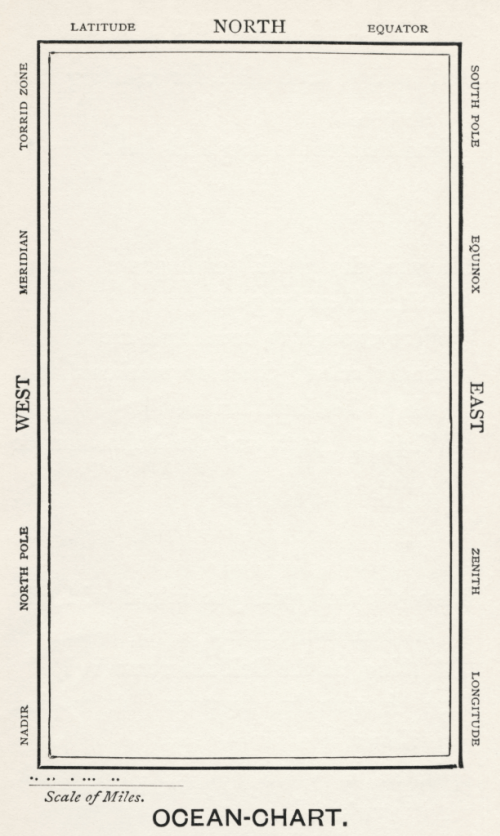
MapCarte316_snarkThe old adage less is more is a mantra of map design. While adding detail to show complexity is important, particularly in thematic or statistical cartography, it’s often possible to achieve it through a minimalist approach. For topographic mapping, the white spaces no longer suggest a lack of knowledge that needs filling with strange mythical creatures, but a graphical brevity. Being overly ornate detracts from the message of a map and beautiful, aesthetically pleasing maps are often those that appear quite stark at first glance. This map is possibly the most stark of the lot…a humorous take on large scale mapping at a scale of 1:1 accompanying the famous Lewis Carroll nonsense poem The Hunting of the Snark (An Agony in 8 Fits).

The plot of the poem is of ten crew on a tall ship hunting the Snark yet it’s been interpreted to have many meanings. The poem was illustrated by Henry Holliday who also drafted the Ocean Chart map to accompanycomments in the poem itself that can be easily interpreted as a commentary on the problems of maps and map interpretation:

He had bought a large map representing the sea,
Without the least vestige of land:
And the crew were much pleased when they found it to be
A map they could all understand.

“What’s the good of Mercator’s North Poles and Equators,
Tropics, Zones, and Meridian Lines?” 
So the Bellman would cry: and the crew would reply
“They are merely conventional signs!

“Other maps are such shapes, with their islands and capes!
But we’ve got our brave Captain to thank: 
(So the crew would protest) “that he’s bought us the best—
A perfect and absolute blank!”

The poem alludes to problems of interpreting complex maps and that the poor crew, who lacked the ability to read a map were delighted to see that the ocean chart, being blank, was perfectly understandable and represented the vast emptiness of the ocean perfectly. That said, the surrounding random map and associated terms are haphazardly arranged to cause maximum confusion, regardless of which orientation in which the map is held.

It’s difficult to argue with the accuracy and clarity of the map. More seriously, it reminds us of the need for accuracy, meeting our user’s abilities in interpretation, not getting overly caught up in convention when a more appropriate approach may be useful, and also the need to use white space wisely.

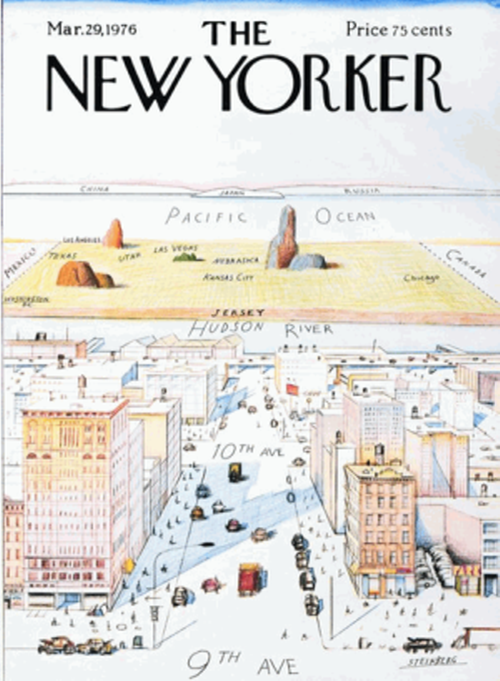
MapCarte 296/365: View of the World from 9th Avenue by Saul Steinberg, 1976

MapCarte296_newyorker

Maps make very evocative and attractive covers for books, magazines and pretty much anything! Done well, they can add a sense of place to say something of the content within. Their composition, density of detail, colours and style often speaks to the audience and will go a large way to attract them to the product. They can be overt marketing tools or they can simply be pleasing on the eye and only later become remembered as something rather unique.

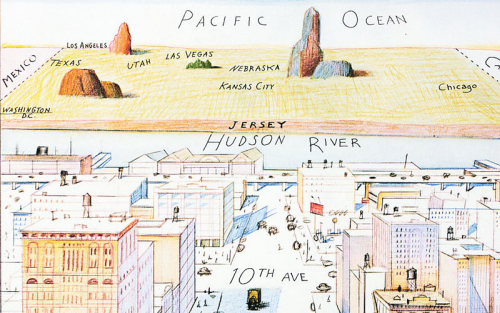
This 1976 cover of The New Yorker is probably instantly recognisable because it holds this special status as a widely viewed ‘classic’ magazine cover. Drawn by Saul Steinberg, the drawing shows the view of the rest of the world from Manhattan (or perhaps an outsiders’ view of New Yorkers’ self image). Unremarkable? Not really. Here is a statement of Manhattan being seen as the centre of the world. It suggests this is the view of the world shared by New Yorkers who know the detail of the centre of their city, just about get to the Hudson River and then see nothing but a vast, rather empty Jersey beyond which is nothing except the Pacific Ocean and China, Japan and Russia on the horizon.

MapCarte296_newyorker_detailIt’s a wonderful illustration that mixes architectural clean lines with typeography that seems an afterthought yet helps the sense of perspective. Steinberg drew many covers and illustrations for The New Yorker of which this is by far the most famous. The proportions of the page used for Manhattan vs the rest of the world and the width of the Hudson River compared with the Pacific are not accidental. The rest of the world is shown about the size of three city blocks. The Pacific is narrower than the Hudson. The ‘Jersey’ label is shown in bold compared to the rest of the labels beyond the river. These are very deliberate design decisions that reinforce the overall message. They are subtle ways in which as an artist Steinberg can shape the way people view the map and form their image.

This is also how cartographers can shape their work with subtle modifications to the design, placement and style of map elements that promote, demote and reinforce a message.


MapCarte 154/365: Sicilian Mafia by Peter Brookes, 1986

MapCarte154_brookesCartoonists and satirists find great inspiration from maps and this often leads them to use, modify or base their own work on them. Maps give us such iconic shapes that we relate to instinctively. We most likely know the shape of our own country and also of those we are most familiar with. The shapes are unique and so they become symbols in their own right. The fact they then have a symbolic association means it’s very easy to attach other imagery to the shapes to create new work. This is often satirical in nature as national stereotypes are contorted into country shapes.

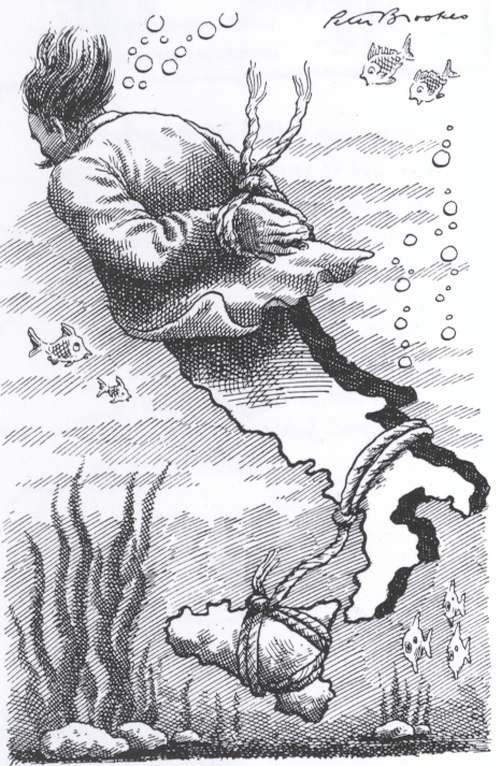
There is a long tradition of cartoons being published in daily newspapers as a way to provide a commentary on the day’s events. Cartoonists are always seeking to entertain but to be clever in the juxtaposition of their work and some overarching political, social or economic message. Here, The Times’ cartoonist Peter Brookes goes to work on a theme that explores the Italian Mafia. The association with Sicily is clear and the narrative of the victim of Italy being dragged to a watery grave resonates as being stereotypical of the way some of the Mafia’s victims may have died. The political message is clear – the ongoing issues of the Mafia and their underlying involvement in politics is dragging the country down. It’s being shackled by the problems and drowning.

It’s a very simple, clear message that commented on the state of Italian politics and the involvement of the Mafia at the time. The fact that Italy is shaped like it is, that it is so recognisable and that Sicily could be used as a rock to drag the rest of the country down was a gift to Brookes. He took considerable artistic licence for the north of the country but you do not need the entire shape to make use of the important component of the southern half. The subdivision of the country is neatly handled by placing a jacket across the northern half and simply using the country as legs and feet.

Having the imagination to see satire in graphical work and to incorporate maps into the design is not an easy task. Maps have many uses and as shapes in their own right they provide us with rich, unique symbology.

MapCarte 104/365: Angling in Troubled Waters: a Serio-Comic map of Europe by Fred W Rose, 1899

MapCarte104_rose

Outside of national mapping agencies, reference and statistical cartography many of the maps we see and enjoy regularly are satirical. They are designed to provoke some emotional response often based on stereotypical imagery and labels. We are meant to see them as light-hearted in the main though, of course, they can be successfully used to make very powerful political or socio-economic statements.

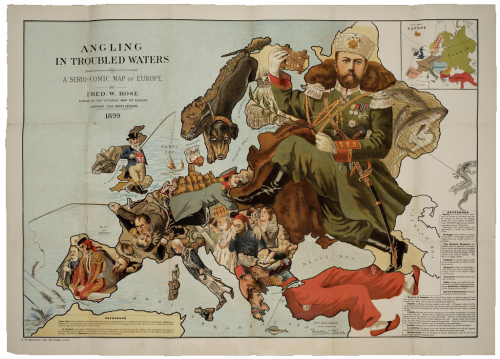
Fred Rose’s pictorial illustration depicts the threat posed to British interests by Russian territorial ambitions during the Balkan crisis in late Imperial Europe.  It falls into the latter category of propaganda mapping though takes a highly artistic approach in an attempt to woo the reader with humour. Rose’s concept is simply to take country boundaries and paint a picture of an individual that represents some particular national identity. The use of maps in this way feature heavily in cartoons and other satirical works where familiar shapes of countries are coupled with images of people or events to make a geopolitical point. Rose makes good use of the fishing metaphor to illustrate which countries are fishing and what their catches (colonial possessions) are.

The title is absolutely critical to this map’s impact. Without it we may wonder what the imagery represents yet the carefully crafted words give us not only a clear key to the metaphor but also lead us to the same impression that the map-maker intends. Certain countries are fishing and being antagonistic or even threatening. Others countries are shown as innocent and under attack. Even the fact the map has a subtitle explaining as a serio-comic map is important – it’s the clear message that this is meant to be taken as satire. Such a statement may be construed as an attempt to avoid accusations from those who may not necessarily appreciate the humour.

It’s a highly illustrative and engaging form of cartography that draws the eye in to explore the interplay between figures and parts of the map.  As a means of stirring debate and controversy, these types of map are a particularly provocative way of capturing the imagination.  The use of map shapes and images as a basis for artistic impression is a good approach to communicate such messages since the outlines of countries are familiar shapes and artists such as Rose successfully play on the familiarity to evoke a response. He provides an exceptional example of the genre with this map.

MapCarte 54/365: The Island by Stephen Walter, 2008

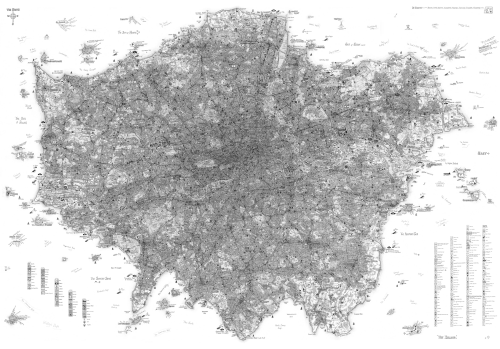
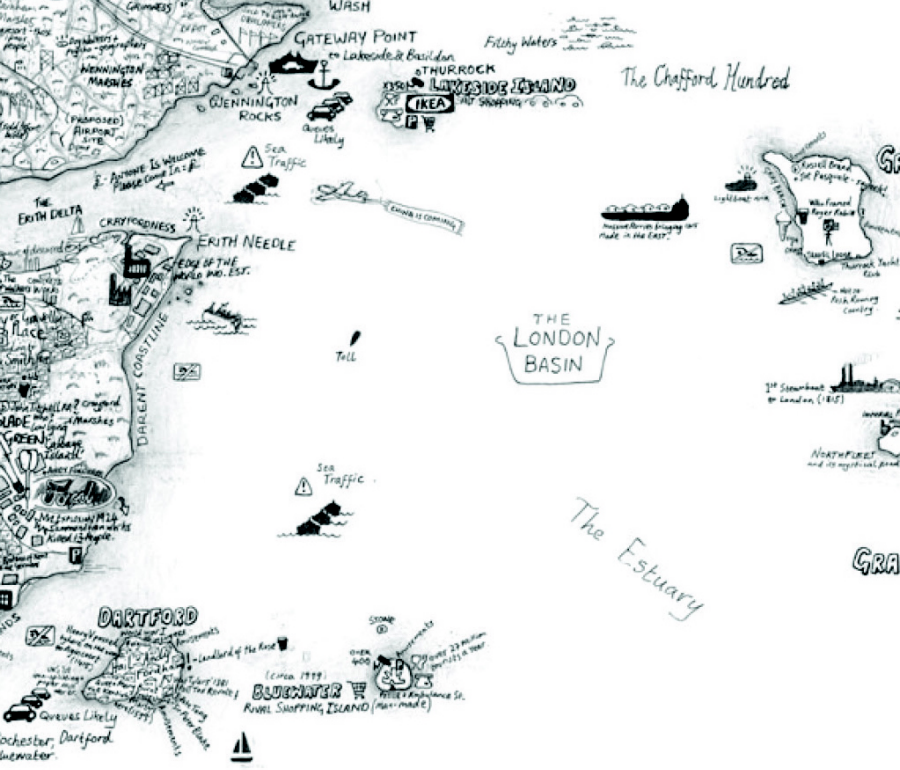
MapCarte54_walterThe Island is a satirical map which takes the view of London, UK being an isolated island floating somewhere amidst its various commuter towns.  It appears independent from the rest of the country, emphasized by the border of Greater London being depicted as a coastline.

Walter’s map is entirely hand drawn using pictorial sketches and text and instead of the known landmarks you might find on a traditional topographic map, he fills the space with a vast array of local information based on his personal knowledge, feelings and impressions of a place.  He details the interesting and mundane and the map becomes a social commentary that invites others to create an emotional bond with the work through a shared lens.

MapCarte54_walter_inset

Walter uses a large format (101 x 153cm) to give himself enough space to contain the intricate detail and builds visual hierarchy in the map through the density of ink. Central London, for instance, contains reverse white type on a black shaded background to emphasize the density of the centre of the city.

Walter has applied the same approach for other cities and also created a negative version (predominantly white on black) for showing subterranean London. His work can be seen on his web site including zoomable versions of many of his maps.

MapCarte 45/365: Rangerland – Sloane is where you find it by Anon, 1982

MapCarte45_sloane

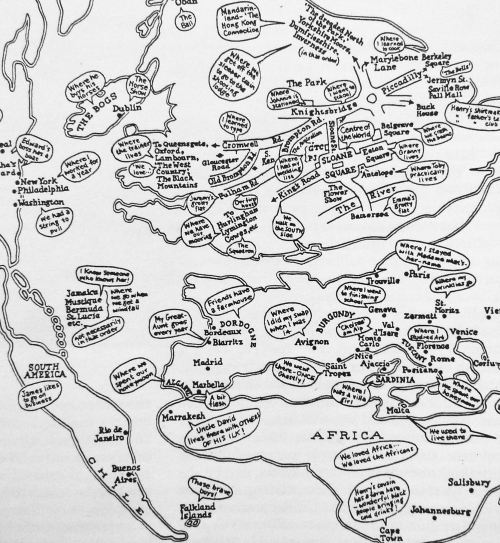
Our mental maps of the world can be impacted by knowledge, experience and our sense of what and where is important to us as individuals. It’s no wonder, then, that our own personal maps are heavily distorted and reflect a warped geography often exaggerating the familiar and ignoring places and detail that are irrelevant to us. When drawn, we often see bizarre landscapes emerge.

Here, a comical take on the mental map of what is important to the individual from ‘Sloane Rangerland’. The shapes of countries are hugely distorted. There’s a focus not only on England but also a wildly exaggerated road network comprising of the important roads around Sloane Square, London. Only the important towns and cities are located with no real sense of hierarchy yet the map works. Its annotations (as speech bubbles) narrate the landscape and demonstrate that hugely personal maps can be successful in communicating a very specific theme.

This map also illustrates the value of mapping in black and white. Colour can often complicate a map so if it’s unnecessary then consider monochrome – it certainly focuses the design thinking.

MapCarte 43/365: Geography Bewitched by Robert Dighton, 1795

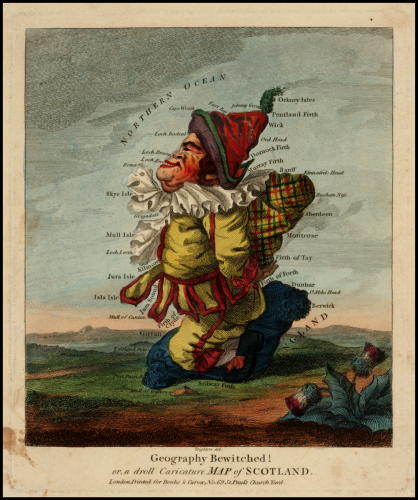
MapCarte43_dightonA great early example of satirical mapping. The use of the shapes of various countries has long been the inspiration or basis for making maps and produces interesting curiosities that match familiar shapes with familiar imagery. This example by Robert Dighton, the well-known !8th century painter and published by Bowles and Carver, was one of a series including England, Wales and Ireland that received similar treatment under the title “Geography Bewitched”.

The map is titled “a droll caricature Map of Scotland” and shows a stereotypical Scotsman in what resembles national costume. Hand coloured, the map positions the character on a landscape complete with Scottish thistle. This style of mapping has been used to good effect in newspapers and cartoons and are particularly collectable.

In terms of design, the artist makes excellent use of the shape of the country in which he fits the caricature. Here, the shape of the map is intrinsically linked to the intended output but supports the general principle of ensuring the map-maker considers the map shape and how it underpins the shape and layout of the overall map page.