MapCarte 367/365: ATP Tennis World Tour Venue Map by Damien Saunder, 2015

MapCarte367_saunderClick on the map to view the web map

We’re currently awash with web maps of this and that which is inevitable as the availability of data and the tools necessary to make maps increases. Quality web maps are still a rare commodity because many still lack the thought required that turns data into something useful and useable. This map is a refreshing highlight. It does one job and does it remarkably well.

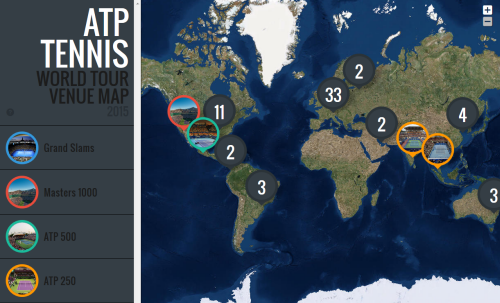
Take a dataset of the locations of all the men’s tennis tournaments for the year and present them across a map. Simple yes…the map could just have a dot for every tournament but at small scales it would look ugly and the dots would be lost amongst the background at large scales. Here, Saunder has taken advantage of the tool of production to have locations aggregate at small scales and ‘explode’ to reveal individual tournaments as you zoom in or you click on the numbered symbols. The fact a few always appear gives the user a clear hint of what to expect when you tackle the numbers.

The side panel is unencumbered and presents the taxonomy of tournaments with simple colour motifs that link to the map. Expanding the side panel allows you to access the tournaments by name or location and is sensibly presented in date order. The information panel opens when you click a tournament to reveal consistent information and the pictures go beyond just showing us the main court of play. Across the map, they reveal a pattern of surface types with hard courts, clay and grass tending to occupy discrete regions. These also tend to reflect the seasons in which a tournament takes place. While the panels contain a lot of content, brevity has been achieved using icons to avoid the need for superfluous text and which presents prize money, the current champion etc in a different visual style. This adds interest and breaks up what might otherwise have been a dense panel of text. The large symbols are a bold statement but they work to fill space and to make the theme and function of the map explicitly figural.  They also work well across an imagery basemap and of course, using imagery means we get to zoom into and see the actual venues.

Fundamentally, a simple but detailed dataset that is handled well in a web map. Clean and clear design thinking underpins the map and elevates it beyond many of its contemporaries that simply dump data and expect the map to work.

MapCarte 366/365: Non-stop by Alberto Lucas López, 2015

MapCarte366_lopezJust when you thought your daily dose of MapCarte from 2014 had finished…here’s the beginnings of a less frequent, intermittent post of great maps on which to feast your cartographic senses.

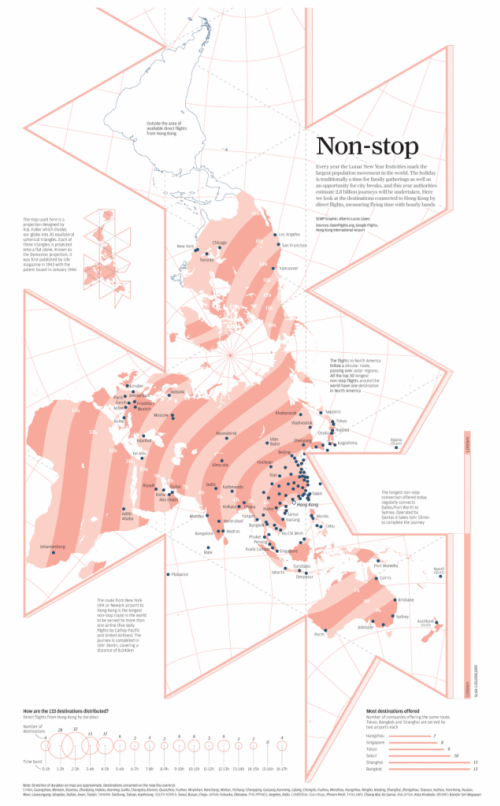
In an age where flashy, spinning, animated, colourful web maps seem to be all the rage it’s refreshing to see that applying some control on your cartography can still bring to life a fantastic example of the art of map-making. Here, Alberto López has created a simple but graphically effective map showing the non-stop flight paths from Hong Kong. The first aspect that grabs you is the use of RB Fuller’s Dymaxion projection. Visually interesting, it adds something unique to the display. The same data could easily be shown across a cylindrical projection or, if we wanted concentric flight time zones, an azimuthal projection dentred on Hong Kong…but the map would not have been as interesting or stimulating.

Similarly, instead of the usual use of flowlines that arc across the map (on a cylindrical projection) or which would radiate from a point (on the azimuthal), López has chosen instead to use time bands.  The simple two colour approach to showing time also echoes the coastline, graticule, map frame and other components. The use of blues for the destinations and also the outline of the area outside the range of non-stop aircraft is subtle and uses contrast to good effect.

There’s a subtle use of two different typefaces, one for the main map components and descriptions and another for the introductory panel that again creates a visually useful and pleasing contrast. The inverted distance band labels in white situates them well in the visual hierarchy. The simple but useful graphs add to the story by showing us some of the salient aspects of the data in a more useful way.

This is effectively a two-colour map (maybe use the blue for all textual components instead of black?) which creates an interesting and engaging map. There’s a lot of good cartographic design going on here to establish good hierarchy, contrast and balance which when brought together creates a great finished product. It doesn’t need to be anything more than it is and proves that keeping things simple is both an art and an effective solution.

The map was published as part of the South China Morning Post’s infographics feature here including links to a larger version.

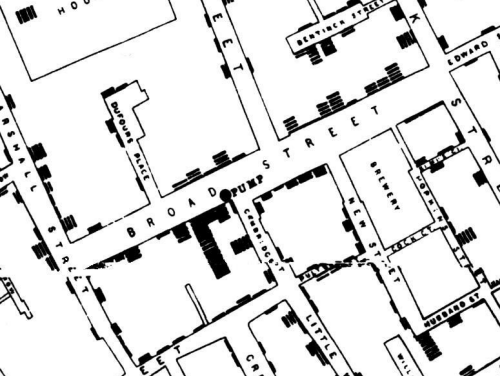
MapCarte 364/365: Detail of area around the Broad Street pump, by John Snow, 1854

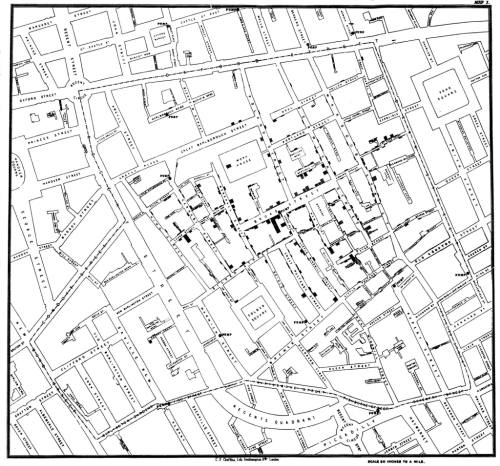
MapCarte365_snowNo-one learns about cartography without studying the map of cholera around the Broad Street pump in Soho, London in the mid 1800s by John Snow. By any measure of importance, Snow’s map has become perhaps the standard-bearer for showing us how a map can say so much more than words alone.

Snow wasn’t a cartographer. In fact many of the maps showcased in MapCarte are by non-cartographers. He was an epidemiologist, a physician and the father of anaesthesia. He was also the personal physician to Queen Victoria. Snow also gave us a classic piece of cartography which resulted in his work in tackling the cholera epidemic of 1854. Knowledge of the disease transmission process was poorly understood. Snow set about trying to make sense of the disease and its spread by plotting all known deaths on a map. It was this instrument that led to his postulating that since most deaths seemed to occur in the vicinity of a water pump on Broad Street then cholera was likely a water borne disease.

“On proceeding to the spot, I found that nearly all the deaths had taken place within a short distance of the [Broad Street] pump. There were only ten deaths in houses situated decidedly nearer to another street-pump. In five of these cases the families of the deceased persons informed me that they always sent to the pump in Broad Street, as they preferred the water to that of the pumps which were nearer. In three other cases, the deceased were children who went to school near the pump in Broad Street…

With regard to the deaths occurring in the locality belonging to the pump, there were 61 instances in which I was informed that the deceased persons used to drink the pump water from Broad Street, either constantly or occasionally…

The result of the inquiry, then, is, that there has been no particular outbreak or prevalence of cholera in this part of London except among the persons who were in the habit of drinking the water of the above-mentioned pump well.

I had an interview with the Board of Guardians of St James’s parish, on the evening of the 7th inst [7 September], and represented the above circumstances to them. In consequence of what I said, the handle of the pump was removed on the following day.
—John Snow, letter to the editor of the Medical Times and Gazette

And so spatial epidemiology was born. Thematic cartography was also brought to the fore as Snow’s overplotting of a phenomena on a street map brought to light new information from the spatial pattern of data.

MapCarte365_snow_detailSnow’s map was ingenious and it’s remarkable that such a simple technique had not become more widely used prior to his efforts. It’s design is so utterly simple that we perhaps ignore its beauty. The simple black and white street network with road labels and the stacked approach to plotting deaths along the roads couldn’t be simpler if we tried to recreate it. The complexity of the study is brought to life through the simple graphical interface of the map. Snow didn’t need any more complex map to interpret his thesis and in so doing, he shows how maps can say so much with so little.

Of course, history tells us that by the time Snow had realized the mode of transmission, and action was taken to remove the handle from the pump, the disease was already abating. That shouldn’t reduce the importance of his work to epidemiology and public health or to his map in relation to cartography. It is rightly one of the most important maps ever made.

You can learn more of Snow’s map through the John Snow Society here or view a digital copy of the book he wrote (which contained the map) here.

MapCarte 363/365: Buyer Beware by National Post, 2012

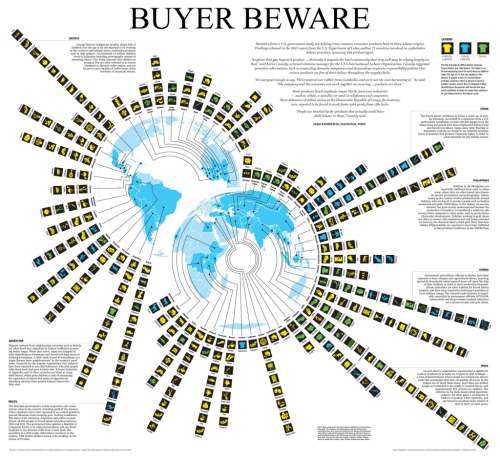
MapCarte363_buyerThe rise of the infographic as a form of representation has brought with it some unwanted baggage. In trugh, information graphics have always been around but giving them a label has suddenly brought them into focus. What most people think of as an infographic might be summed up in this fantastic parody from web-comic XKCD…the list-like approach to representing a vaguely connected set of facts using seemingly random graphical approaches. Maps have always been information graphics. They are a specific form that deals with the spatial representation of data. We use design to encode meaning and to create visually interesting graphics that communicate to an audience. Perhaps where we’ve seen a development over recent years is in the use of maps as anchors for a story; where a different visual aesthetic is formed by bringing together maps, strong non-spatialised graphics and other components such as text. This example shows how a modern map-based infographic brings together the elements in a well-composed display.

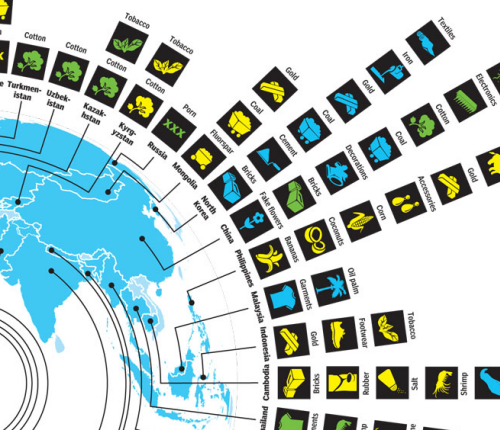
In effect, the infographic approach to cartography emphasises the role of layout in design. The map is used as the core though in truth it’s really used simply as an image. There’s no information encoded into the map itself. It’s devoid of labels or any meaningful data. Instead, it plays the role of the mechanism that leads to other detail and allows us to use forms that might not be useful in other contexts. Here, two azimuthal projections of the globe are organised to support the use of leader lines to the information encoded using systematic, uniform pictorial graphics. Each is represented using the same general form and pictographs encoded with shape and colour give us the detail. The graphics are easily understood and overall, create an interesting pattern on the page, inviting the inquisitive reader.

MapCarte363_buyer_detailThe overall layout is augmented by panels of text that bring the story to the same page rather than an approach which might have seen the map embedded in a passage of text. This combination of the written passages and an interesting graphic gives us a form of graphical story-telling that integrates many different visual components, including maps into a coherent whole. It’s an infographic…but really, at it’s heart, it’s just well designed thematic cartography.

MapCarte 362/365: The United States of Bacon and Kale by Eric Chemi, 2013

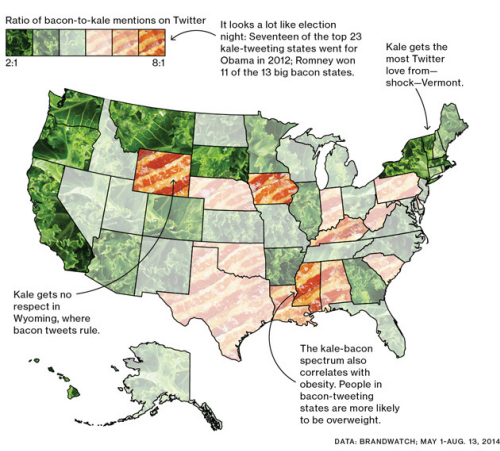
MapCarte364_kaleThe rise of the ‘viral map’ has been something of an anathema to reasoned, considered and accepted principles of cartographic design. Much of what we see across social media and in popular media wouldn’t be considered as representing good design and in most instances there’s every reason to use such maps to highlight the limitations of the map. However, such maps are not all in bad taste and can bring us visually interesting examples of map-making that while not necessarily exhibiting classic cartographic design bring a new aesthetic to the body of cartographic work. This example by Eric Chemi accompanied a short news blog that looked at the spatial distribution of tweets that mentioned kale compared to mentions of bacon. Such subjects seem to be tailor made for the production of quick and dirty maps but this example proves that with a little care and thought, the map can actually become something visually interesting despite the whimsy. In fact, it’s entirely possible that such maps comprise a new form of ‘whimsical cartography’. Done well, like this example, shows us that design has no fixed boundaries and allows us to bring together a rich and varied palette of visual forms.

While a standard choropleth with diverging colour scheme would have been fine, the medium of publication possibly demands something more attention grabbing. Instead, the map-maker has transposed images of kale and bacon onto the palette and varied the opacity of the image to give a sense of magnitude. We can easily see the states with the highest ratio of kale or bacon tweets. We can see the states where there is a closer balance. It’s a simple approach but one which supports the congnitive process required. It’s also visually interesting. The addition of a few key textual components adds to the map by highlighting some useful nuggets of information. In this way, a rather bland choropleth map has been re-invented to give us a far more interesting visual feast…literally.

Done well, the simple map which accompanies relatively trivial media blog posts can bring us something unique and visually interesting. It exemplifies the fact that design is important in so many contexts to ensure that we don’t relegate the map to a pointless supporting role. Here, the map becomes one of the key take-aways, the key visual that people recall and a talking point in itself. That’s design.


MapCarte 358/365: Cairo to Khartoum by The Graphic, 1884

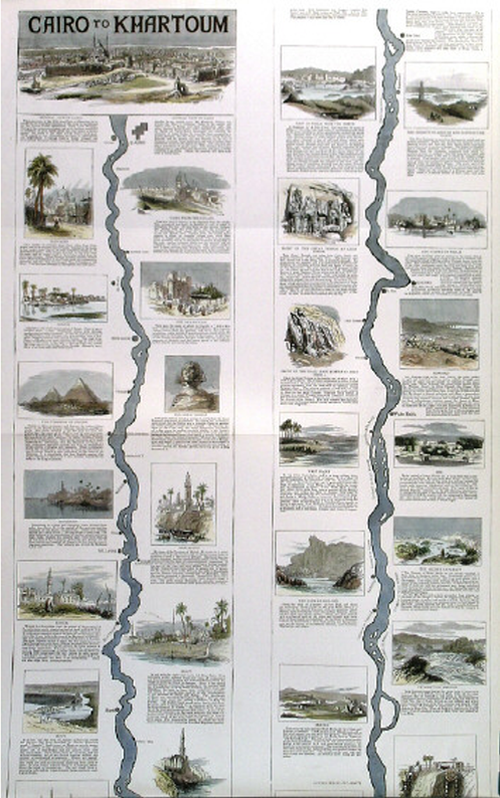
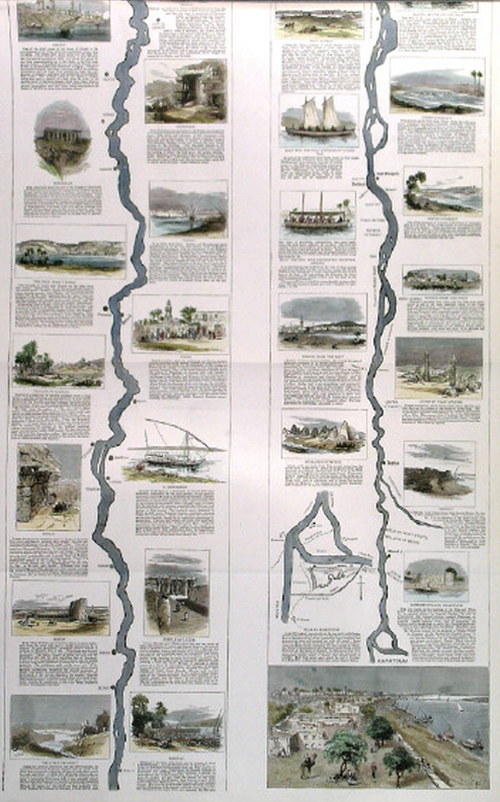
MapCarte358_cairokhartoum1MapCarte358_cairokhartoum2Selection and omission is a key cartographic requirement. We make many decisions about the content of the map. One of the more dramatic consequences of this process is omission of all but a single geographic feature and this map of the River Nile from the late 1800s illustrates the principle perfectly. The whole river itself is over 4,000 miles in length and 2 miles in width at it’s widest. It passes through 11 different countries, though this map only illustrates the portion from Khartoum (where the Blue and White Nile meet) to the coast at Cairo.

General reference maps simply wouldn’t suit the purpose of highlighting the settlements and places along a river. The scale wouldn’t allow it and the amount of white space would make the balance of the map inappropriate. You’d be forced into adding all sorts of other topographic detail simply to fill space.

Instead, as a supplement to The Graphic, this map focuses on just the river. It becomes a linear cartogram with some segments straightened and a lack of almost all other topographic detail except for places that directly border the river itself. It’s akin to some of the classic early strip maps used to map roads and it translates well to a river. The river becomes the central anchor to the two page spread and around it are beautifully illustrated vignettes – panoramic scenes of the towns, villages and natural scenery along the river.

Maps can omit so much and still be perfectly suited to telling the story of the form itself. Here, the river and only the river. It makes perfect sense to omit all else.

MapCarte 353/365: Life in Los Angeles by Eugene Turner, 1977

MapCarte353_chernoffMapping multivariate statistical data is fraught with difficulties due to the problem of encoding multiple pieces of information into a coherent yet simple symbol design. The balance between making your data readable and understandable is harder, the more pieces of data you want to show. It’s also very easy to end up with symbol overload that easily translates to cognitive overload.

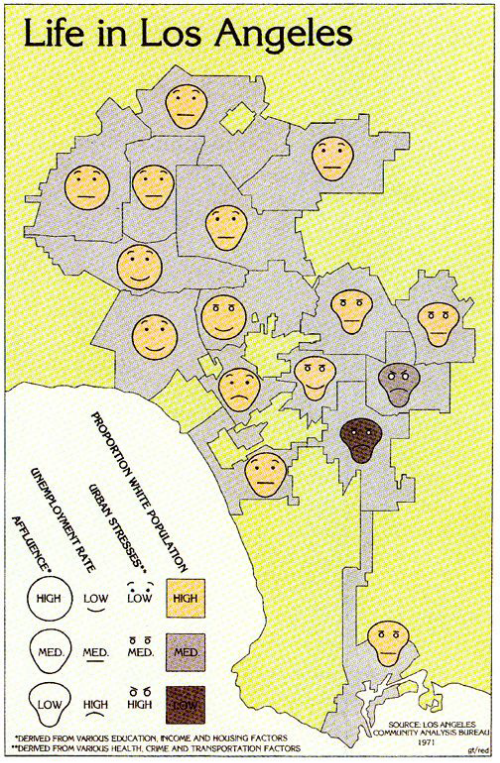
In 1973, Herman Chernoff an applied mathematician, published a paper in which he proposed the use of a human face to display multivariate data in the shape of the human face. The idea was simple – change the shape, size, placement and orientation of different facial features to encode different variables. The overall result changed the face and the facial expression which brought an overall sense to the combination of data. Chernoff argued that small changes can be seen in human faces due to our innate ability to recognise human faces and their subtle differences. They are extremely economical graphical structures in which

Of course, choosing how to reflect the data in different facial features is fundamental. Here. Eugene Turner creates what has become a well used example of the genre, though the use of Chernoff Faces has courted controversy and not seen a huge uptake largely due to difficulties in construction. The additional problem is in the way in which we automatically interpret the faces through our impression of emotion. Hence the crucial need to ensure your variables are mapped in a way that works rather than one which conveys the wrong emotional response. Turner does a good job of building a facial profile out of social conditions and ethnicity. It’s a simple map but one that characterises the spatial structure of socio-economic life in Los Angeles. It’s also a provocative and arresting image and one which is difficult to hide from.

Chernoff faces deserve a mention in any design related commentary because they are innovative. They’re hard to employ correctly but even if only a small proportion of our data can be effectively mapped using them, they’re still a useful tool in the cartographer’s design armoury.

Chernoff’s original paper can be downloaded here.


MapCarte 349/365: Density equalizing cartogram by Michael Gastner and Mark Newman, 2004

MapCarte349_cartogramThe so-called Holy Grail of cartograms was solved by Michael Gastner and Mark Newman and published in 2004. To this point, cartograms had largely been abstract maps; they took various geometric shapes such as circles and then re-sized and re-positioned them. The result was a map without a map…there was very little of the underlying geography depicted and in some respects they were simply spatial graphs, or the thematic part of a thematic map without any sense of the geography that they more normally sit atop of.

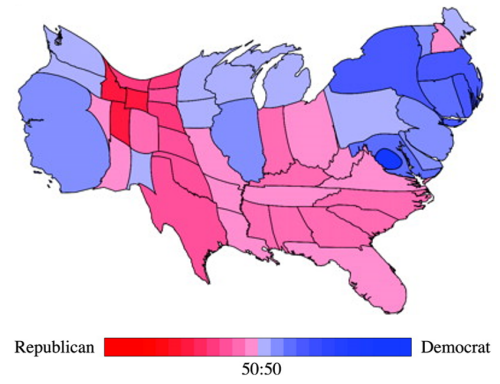
At the heart of a cartogram is the use of symbols to represent geographic regions in proportion to the variable being mapped. To do this, one normally has to severely distort shapes or revert to geometric symbols. These can make such maps difficult to read because they no longer look like the very places they are supposed to represent. Gastner and Newman brought a new approach to the calculation of their cartogram by making use of elementary physics. This in itself was innovative since they borrowed logic and algorithms from the science of physics and applied it to cartography. They demonstrated their work using data from the 2000 U.S. Presidential election which illustrates how the U.S.A. map is modified by the share of the vote, thus giving equal visual weight to the key data being mapped as well as retaining the general impression of a map of the U.S.

The technique is referred to as density equalising because it uses a variable to normalize the map shape. It’s almost the inverse of a choropleth whereby one would normalize the data values to take account of the size of area; instead the actual values are mapped but the size of the areas are modified so they are visually equivalent in prominence. The result was an elegant solution to the search for a cartogram that allowed the user to show different magnitudes by area and at the same time preserve shape sufficient enough to make it recognisable. In effect, the map is warped yet shared boundaries are retained in their correct topological state. The map retains the essential elements of the original shapes and leaves readers with the ability to recognise the shapes.

Cartograms are visually arresting as images. Gastner and Newman’s work produced a new technique that enables them to be just that bit more understandable.

You can read their original paper here.

MapCarte 326/365: The contiguous United States by distance to the nearest McDonalds by Stephen Von Worley, 2009

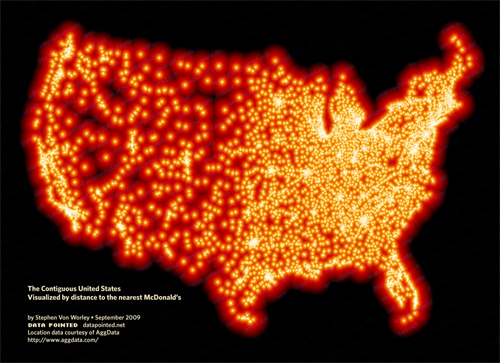
MapCarte326_mcdonaldsMaps are powerful ways to get a message across. Often it’s possible to state some fact to do with a spatial question or a theme but mapping it takes it to a whole different dimension. For instance, in 2009 Stephen Von Worley started thinking about the rise of the country strip mall in the United States and what it meant to the spatial identity of wilderness. In short, he asked himself a question: how far away can you get from our world of generic convenience? Well there’s no dataset that’s going to give you that straight answer so he used a proxy…and he set about mapping that proxy to show how far you can get from McDonald’s restaurants.

He decided McDonald’s was a good fit for the study because of the way in which it colonizes such centres and towns. The 13,000 restaurants mapped are the result. In design terms he could have simply positioned dots but he’s used distance symbolized by changing colour to show the closeness to a McDonalds (bright yellow), through reds to the darkness of what he calls the “McFarthest spot”; the real wilderness between McDonalds. You travel through red to get there…the blackness. Of course, he’s cleverly used McDonalds corporate colours and a non-too subtle use of black to connotate emptiness but it makes the map work well. It’s got a strong aesthetic and lacks the need for any additional description.

This is perhaps as close as you can get to a visual data dump but simple symbolization decisions and choices create an attention-grabbing and visually arresting image that speaks to the original question. It’s also worth pointing out the use of an appropriate projection that doesn’t distort shapes or areas. A small decision that makes the map visually accurate.

You can read more about the map on the Datapointed blog here.

MapCarte 303/365: London: The Information Capital by James Cheshire and Oliver Uberti, 2014

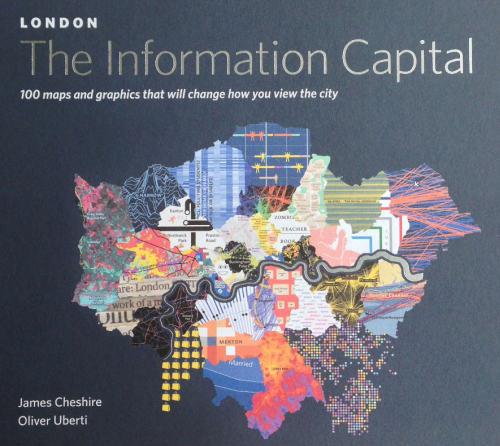
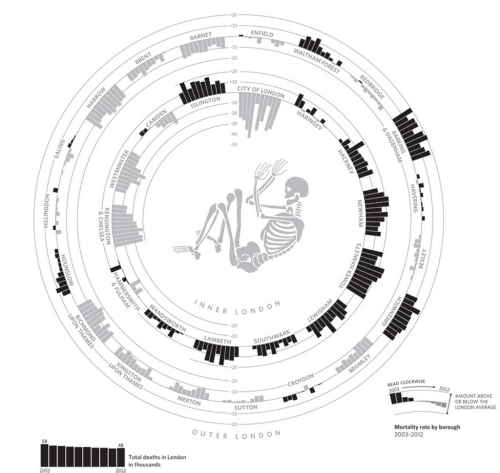
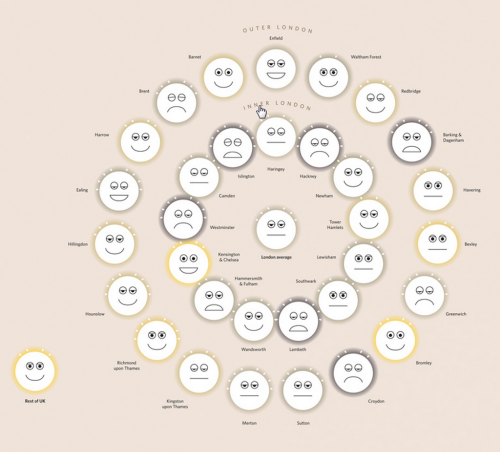
MapCarte303_cheshire1This is likely to be the only entry in MapCarte that can claim to have achieved the standards of design and innovation required to be discussed herein before it’s even been published. This new book of 100 maps of London by James Cheshire and Oliver Uberti is actually published today and having seen the pre-press material some weeks ago it was clear that one or two of the maps were special. Indeed, the more one saw of the work in the book, the more it became obvious this entry should celebrate the entire book rather than attempt to select one or two noteworthy examples. It’s an atlas of noteworthy examples and that’s a strong statement before all of the maps have been seen. Some accolade – but this is a book that contains some of the very best of modern cartography which sits at the intersection of information graphics, compelling storytelling and inspiring cartography.

MapCarte303_cheshire2This book is the collaboration of geographer and visual journalist. Geographer Cheshire has produced some fantastic previous work (featured in MapCarte 7) and here, he takes his keen eye for the interesting and obscure and translates the data into simple, clean yet imaginative maps with the help of Uberti. Self-described as a visual journalist, Uberti clearly knows how to shape a story using beautiful graphics. The combination works well and the team have produced a fantastic array of visual treats, each using different graphical approaches but without falling into the trap of making each map different just for the sake of making it different.

MapCarte303_cheshire7For any cartographer, the book contains a plethora of brave and rich design. The unique approaches taken to displaying the data bring something very different to the world of mapping. These are no ordinary thematic maps. They stretch the boundaries of convention and deliver works that engages not only our interest in the themes but our interest in how the design has been constructed and how it works. It’s a coffee table book for the average punter interested in a fascinating look at London but for anyone interested in cartography it offers something much more.

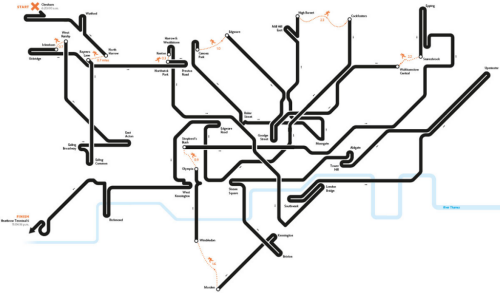
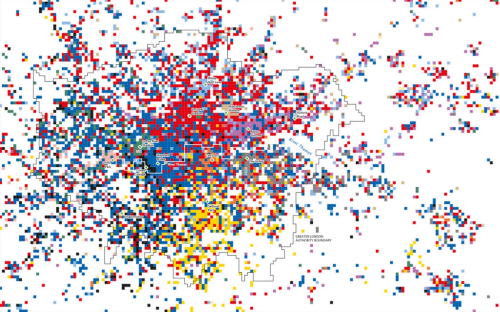
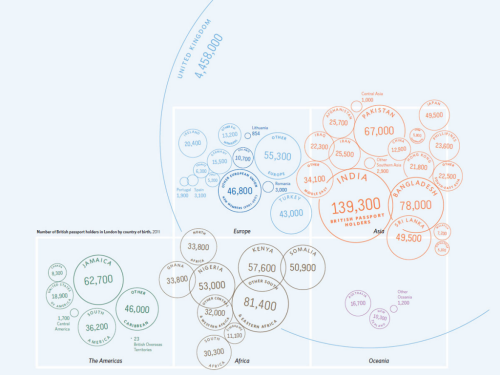
MapCarte303_cheshire8Maps showing the optimal route through the London Underground take the familiar and cast it in such a way that we immediately see the path. The map of football supporter territories is a patchwork of small raster cells. The map showing the number of passport holders in London by nationality brilliantly uses a symbolic round passport stamp as a proportional symbol that contains both label and number and also clusters using colour to represent continents. Overlaps do not matter. It’s a cartogram and the design works wonderfully.

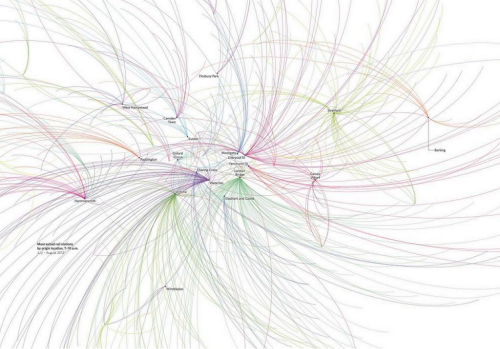
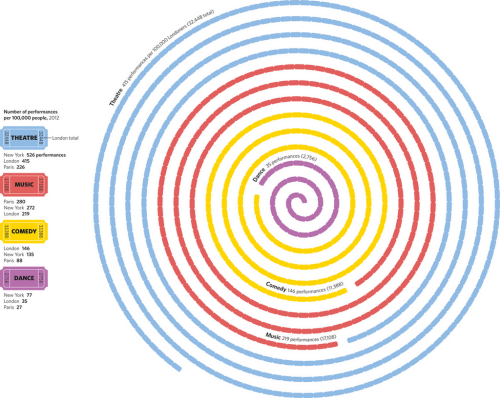
MapCarte303_cheshire6Flow maps of Oyster card tap ins to represent commuter journeys, the distribution of entertainment by type as a strip of tickets and the arrangement of bar charts organised to represent the shape of inner and outer London all play with geography but retain the essential message.MapCarte303_cheshire5 MapCarte303_cheshire4Not all the graphics and map types are entirely original in the sense that it’s impossible to create 100 new map types. The treatment is original though; highly original. And the authors have also plundered the archives to resurrect and make fine use of some arguably under-used techniques like Chernof Faces and Coxcombs.

MapCarte303_cheshire3Altogether a superb illustration of the art of cartography. A masterful appreciation of data and the ability to distil it into meaningful and interesting maps. Each map offers up something new and interesting. They go beyond the mundane and create a portfolio of design to inspire and delight any map nerd and many more besides.

The authors ask interesting questions that they then translate into maps and take their inspiration for mapping the fascinating facts of London from previous pioneers of London mapping such as Harry Beck, Charles Booth and John Snow. It works. This book stands shoulder to shoulder with some of the very best in thematic mapping to paint a portrait of the city.

You can explore the book further at the web site here or via James Cheshire’s web site here.