MapCarte 340/365: Airspace: the invisible infrastructure by NATS, 2014

Cinematic cartography provides us with a sumptuous feast of data representation. It captures the intricacies and patterns of large datasets and, in particular, those that have some element of flow or movement about them. Here, NATS give us a state-of-the-art 2 minute 30 second video showing the patterns of air traffic in and out of UK airspace over a 24hr period incorporating some 7,000 separate flight movements.

Of course, there are the usual flights in and out of the UK in addition to local flights but there’s also some really fascinating vignettes and what NATS do well is not simply present the viewer with a mass of moving stuff…they have gone to the effort of incorporating text and moving the image around to explain precisely what is being seen. This teasing out of individual elements gives context to the overall patterns and allows us to appreciate the complexity all the more.

There’s an ebb and flow of movement beginning with transatlantic traffic, then European arrivals followed by the first wave of departures and the congestion build up around the usual nodes of London, Manchester and central Scotland. They then focus on the holding stacks over Heathrow airport before picking out some military training flights and the movement of oil-rig workers from Aberdeen to North Sea rigs.

The aesthetic of the film perfectly matches the function with darker base elements and glowing flow lines. The marginalia and textual components are in balance with the overall piece and the movement, panning and zooming works well to take us on a tour without awkward jolts visually or in relation to the content in view. Speed, resolution and camera control are perfectly attuned to give the viewer a pleasing visual experience.

Fascinating and beautiful. The melding of cartography with large fluid datasets in an engaging form.

You can read more about the video and also links to other similar works from NATS on their web site here.

MapCarte 332/365: Flight patterns by Aaron Koblin, 2006

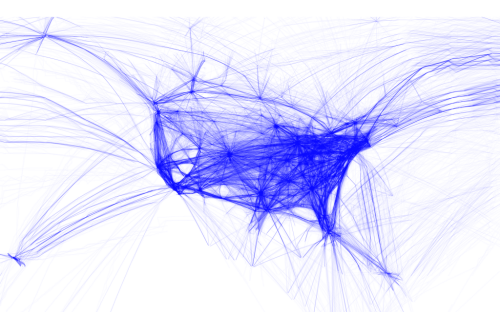
MapCarte332_koblin1Making maps from digital data has become a key outcome of the democratization of data and the use of the internet to store and share. Ad to that the availability of a wide range of digital mapping tools from full-scale professional GIS, through high-end illustration packages to open source offerings and new players offering ways to build maps through coded solutions. Each to their own but there’s a rich suite of products to suit tastes and abilities. A number of people have played with flight data from openflight.org but here, Aaron Koblin goes that extra mile to create a range of different products.

He used the Processing language to convert origins and destinations to geodectic curves to show all commercial flights routes between paired airports. His products are relatively simple…perhaps more data art than map but certainly their end appearance is map-like and they portray spatial relationships. He has created a number of alternatives that show all routes or which classify them by colour based on make or model of aircraft. He’s extracting the detail in the data and working with them in map form.

MapCarte332_koblin2His maps aren’t just static though. There are zoomable slippy maps that show the work in greater detail, overcoming one of the limitations of digital map design that means we have a constrained format. The ability to use multiple scales means we can design across a range of scales despite the dimensions of the viewing mechanism being relatively constrictive.

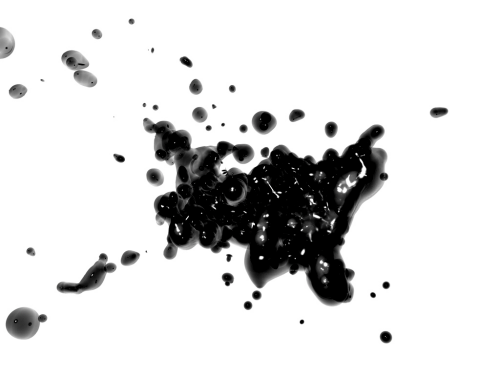
MapCarte332_koblin3Finally, he turns the relatively easily understood linear representations into animations and more artistic forms such as the blobular version. Of course, this perhaps ventures a little far from a form that allows people to interpret the data but it’s bringing new approaches to the cartographic aesthetic. Experimentation with form is useful. It perhaps doesn’t always carry a function other than to look appealing but beautiful data art is pleasing cartography all the same.

You can see more of Koblin’s flight patterns here and here.

MapCarte 257/365: Escape the map by Mercedes Benz, 2011

Escape the map was an online advertisement for Mercedes-Benz.  It offers an immersive, interactive experience for the viewer who becomes a participant in the map-based story.  The work has drama, doesn’t overtly force the brand and follows a ‘choose your own adventure’ type plot.  It’s sophisticated, memorable and unique.

The map and map related objects like the falling map pins and address (locator) are key metaphors in the story.  The advert immerses you in the future, how we may use maps in cars and how important location is and will become not just for navigation but as a defining way of living.  The heads up display on the electronic paper map works particularly well.

The work clearly illustrates how popular maps have become in the mass media and there are numerous references to familiar online web map services, virtual globes and their techniques (such as facial blurring on Google Street View) as well as having a sub-plot that references social media such as Twitter.  This familiarity with ubiquitous mapping and social media tools means the advertisement hooks us into a familiar world to tell its futuristic story.

MapCarte 233/365: New York’s Carbon Emissions by Carbon Visuals, 2011

Animation can be an extremely effective visual tool because it helps us visualize temporal patterns in a way that time slices cannot. Normally, though, we’re mapping something tangible; something that we can plot at different points in time and whose trace is only really seen once we’ve stitched the different slices together. Here, though, a different approach to cinematic cartography gives us a powerful message.

Carbon Visuals wanted a way of visually expressing the amount of New York’s carbon emissions over an hour, a week, a month and a year. These blocks of time are easy to imagine when we look at the map…but what is it we’re to look at? The data could easily have been presented as a histogram or some other graphical method but they went much further.

A 3D cityscape is used and we move through street level, eventually pulling up and over the top of the city to see it at a much smaller scale. The Carbon emissions are illustrated through inflated balls and as we move through time, more and more balls are added. The cityscape is rendered in light grey…the balls in blue and the contrast helps us easily pick out the two dimensions of the map. Space is simply a placeholder but it gives us scale and as we slowly pull back from the street to the wide view and the balls increase exponentially we see the mass of blue overwhelming the city.

Comparisons are always useful in cartography and Carbon Visuals use it to great effect here. Clean and simple but emotionally charged and undeniably impactful.

More details of this map on the Carbon Visuals web site here.

MapCarte 227/365: U.S. Daily Temperature Anomalies 1964-2013 by Enigma labs, 2013

MapCarte227_anomalies

Click image to view web map

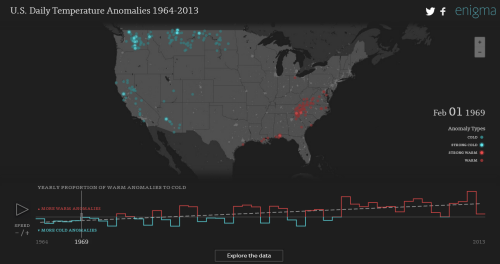
We’re almost drowning in data these days. The impact of the various Open movements is seeing the unlocking and emancipation of so much data from both private and public bodies. This causes difficulties in a sense because there always seems to be a race to do the coolest visualization in the shortest amount of time with any new dataset…and that usually leads to some pretty poor cartography. Quality so often takes second place to speed and the desire to be seen to be the first to have published something. Occasionally though, we see a gem and this web map of U.S. daily temperature anomolies is one such example.

There’s a huge amount of data to be sifted and for an approach to displaying the salient characteristics to be determined. A minimalist map base works well – anything to simplify the experience and give the reader a fighting chance at understanding the patterns is going to help. Colour is also at a minimum with just reds and colds used to signify major temperature trends. A counter keeps us up-to-date with the date and provides a useful visual anchor. The patterns of flashing dots dance across the map and because they tend to appear in waves we don’t get the usual disorienting impact of flashing maps.

The data has been simply categorised to make it clear and instantly recognisable and the chart provides a useful way to position the map in time in relation to the longitudinal data. The user interface is well crafted and everywhere you expect functionality, you get it. The map has basic pan and zoom; the graph slider can be moved. The animation can be paused and you can change the animation speed. The best bit, though, is the map is just the beginning. The data can be explored and scrolling down the page reveals well written, digestible detail, again presented with clear graphics in a strong layout.

Web maps that use defaults tend to suffer. When you go beyond the defaults and really think about each element of your work you develop something that is clearly in a league of its own (carto)graphically.


MapCarte 214/365: Breathing Earth by John Nelson, 2013

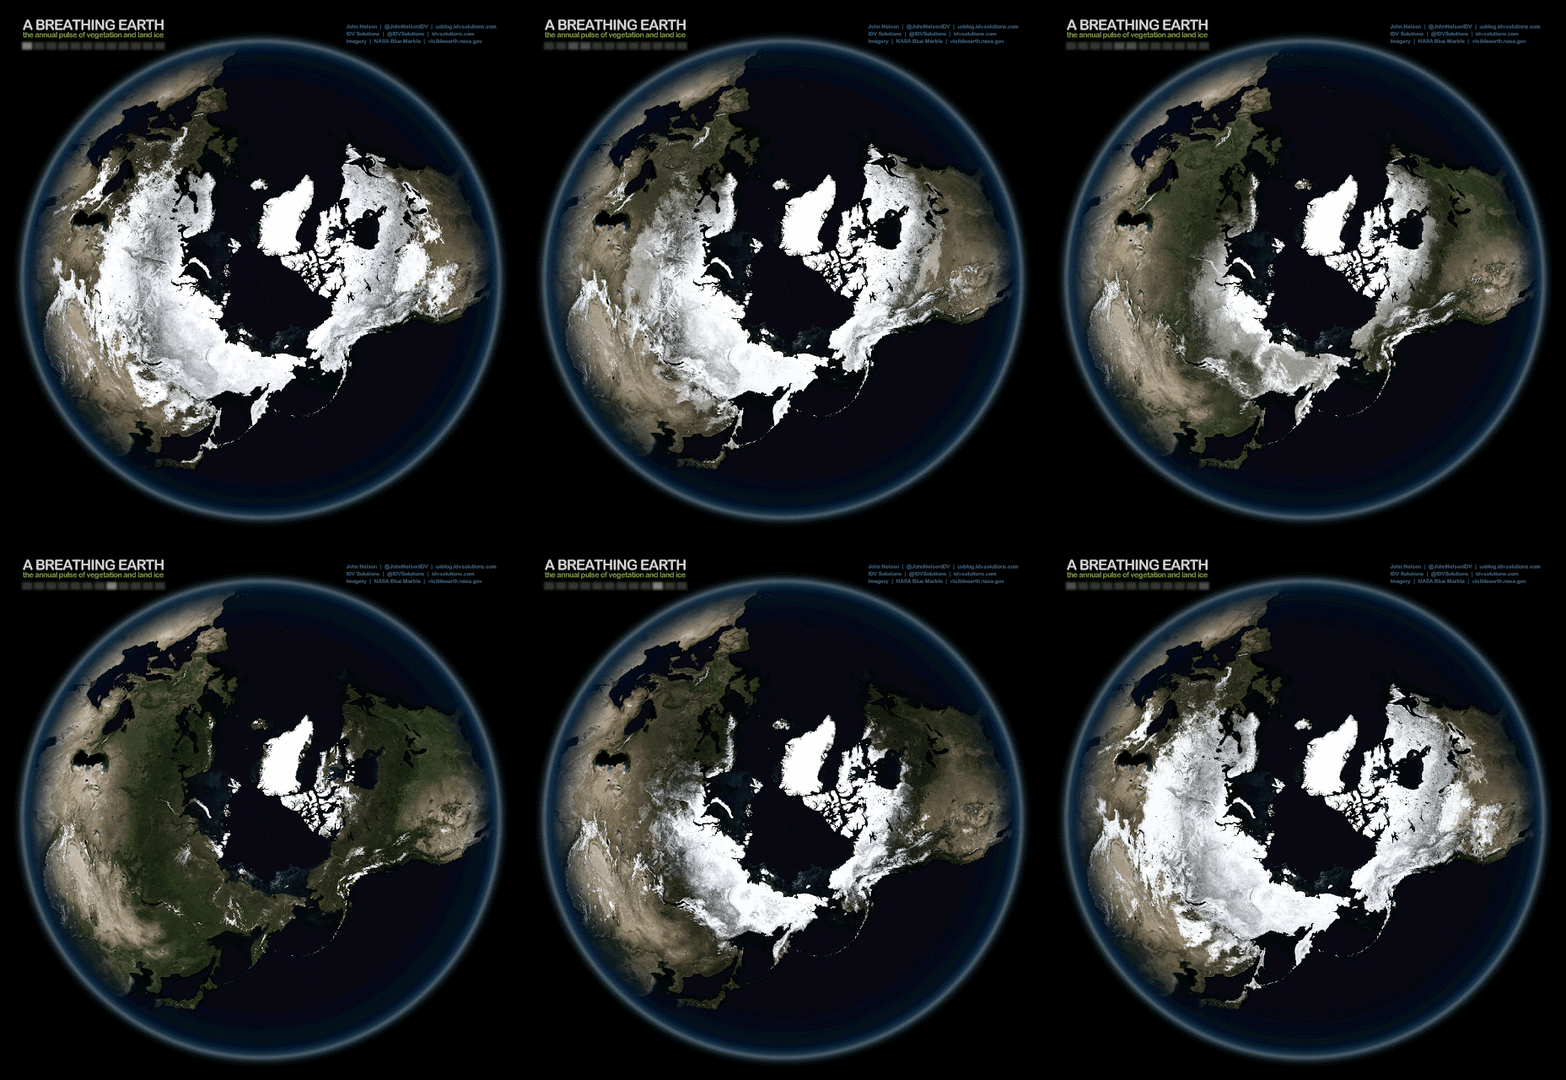
Animation in cartography can be a difficult beast to tame. Usually we use animation to show some sort of temporal change but as we animate we introduce cognitive load and complexity for our readers so we should be mindful to strip back the content to compensate. That often makes the map less purposeful as a result. When used effectively, animation can bring to light a pattern that might otherwise not have been evident and this is the impact John Nelson’s breathing earth has here.

It’s a matter of fact that global snow and ice cover changes annually but how do you show it? Nelson does several things well in this work. He uses a simple dataset…cloud free satellite imagery, one for each month. He picks the right projection (a polar azimuthal) which gives us focus for the content being mapped. He keeps everything simple and gives us a moving, pulsing legend to keep track of the month.

The results are great. Simple concept, simple product but anything but simple thinking about design and cartography.

Further details about the map and several alternatives can be found here.


MapCarte 204/365: NYC Taxis: A day in the life by Chris Whong, 2014

MapCarte204_NYCtaxiClick image to view web map

Increasing access to unique and intriguing datasets is driving a massive map-making movement. People are exploring data in many interesting ways and occasionally developing some creative cartographic products in the online medium particularly. Chris Wong has done just that. Taking a dataset of different New York taxi cab fares he’s processed and manipulated the data into a form that can be mapped in a compelling way.

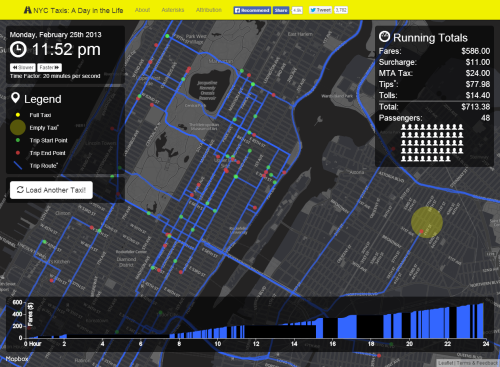
Notwithstanding any dataset such as this is prone to some level of uncertainty and the fact that Wong took some cartographic license (the actual routes mapped are based on the Google API suggestion, not a GPS tracklog for instance) it’s the mapping that is really quite impressive.

By taking a single journey we are pairing the data right back from the millions of cab journeys. It helps show how real each cab is and how it travels independently of the rest. Our imagination can extrapolate to the whole and it’s a good way to personalize a theme when mapping. It overcomes the generalisations that must be made to make any sense when mapping the entire dataset.

The mapping is clean and intuitive. The yellow/black theme aligns with the taxi cab colours and creates a sleek, modern look and feel with high contrast between components and good use of ancillary colours and transparency. The hovering data panels provide cumulative information on time and running totals. The graph shows the linear pattern of fare accumulation. The movement of the map is particularly creative as the focal point (the cab) remains central in the map view as the map pans and the journeys are traced. This gives an excellent way of holding the gaze while the map does the work rather than relying on the user to pan and zoom around. It reduces effort on the part of the user who can simply sit back and view the moving map.

A beautiful web map in terms of design and the marrying of form and function.

MapCarte 200/365: Breathing City by Joey Cherdarchuk, 2014

Making maps is all about taking a dataset and making something meaningful from it – something that communicates a finding or a result, or something that speaks to an issue or an emotion. In our democratised mapping world, more people than ever are taking interesting datasets and attempting to produce something map-like. All too often the results leave us frustrated but every now and then a perfect storm creates something magical.

Using a detailed dataset of how Manhattan’s population occupies space during their at home and at work phases of the day, Joey Cherdarchuk could have just plotted it using a standard technique. That wasn’t enough. Using the shape of Manhattan as an inspiration he envisaged a lung…a breathing lung that inhaled and exhaled according to the time of day. The data is animated as the map remains static so we get a breathing city and a breathing map. Adding a simple line graph that mimics a cardiograph monitor simply tops off the combination of visuals, metaphor and thinking that makes this map something special. Using a black background and simple text components frames the work well.

The data is unremarkable…but the map produced makes it intriguing and brings it to life.

Details of how Cherdarchuk constructed it are on his blog here.


MapCarte 181/365: Hubcab by Senseable City Lab, 2014

MapCarte181_hubcap

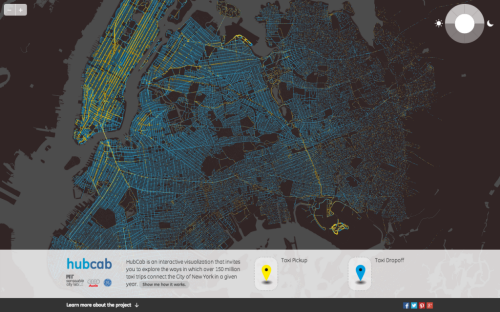
Interactive maps that invite you to explore a big dataset can be intriguing but all to often they fail simply because they are data dumps with little thought to the user needs. Here, the ways in which over 170 million taxi trips connect the City of New York in a given year is the data set. This map provides a unique insight into the inner workings of the city from the unique perspective of the taxi system with a high level of granularity.

HubCab allows users to investigate exactly how and when taxis pick up or drop off individuals and to identify zones of condensed pickup and dropoff activities. It allows you to navigate to the places where your taxi trips start and end and to discover how many other people in your area follow the same travel patterns.

The map can be used to allow an exploitation of collective mobility, patterns of sharing and the authors hope it might be the first step in building a more efficient and cheaper taxi service.

The cartography is clean with simple line work on a dark basemap but it’s the interaction and animations that are particularly well constructed. A good example of exploratory cartography to support exploitation of a large dataset.

Click the image to launch the web site and app.

MapCarte 132/365: LIVE Singapore! by Senseable City Lab, 2011

MapCarte132_senseableCartographic research provides fertile ground for people to conjure up new and impressive work. Such work is largely experimental by design and can take advantage of relatively unrestricted objectives. A lot of research also benefits from being part of a live exhibition where space and format give people a way of exploring interesting new concepts. In some respects, this type of work may be thought of as the equivalent to Formula 1 motor racing in the sense that the investment in one-off technologies provides both a spectacle but also advances engineering that eventually trickles down to the family car. Cartographic experimentation often plays with format and design in a way that we subsequently begin to see in everyday work.

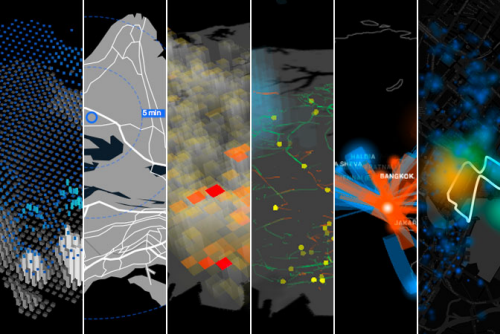
MIT’s senseable city lab are masters of cartographic experimentation. Their LIVE Singapore! series has developed an ecosystem of maps and feeds of information about the city. Their 2011 examples created six different visualizations from six different streams of data about the city. They each showcase a particular theme of relevance to Singapore that is dynamic and immersive and based on monitoring the real-time city through a network of cameras, communication devices and sensors. Of course, the maps they produce are also revealing and communicative. The video below illustrates the 2011 examples and a little of how the examples were seen by visitors to the actual exhibition itself.

What the exhibition initiated was a way to explore the mapping of live data streams as a way to track the pulse of the city. Key to this, cartographicaly, is the use of animation of the map…and animation of the symbology on the map. Moving maps can be quite disorienting and there’s no doubt that it’s difficult to isolate and interpret  a specific moment but much like a film, you’re expected to consider the whole story; perhaps recalling some of the main events (peaks, troughs, highlights).

These maps begin with fairly standard ways of representation but they bring an added dimension to them as techniques through experimentation. We already see evidence of this in maps produced now, some 5 years later.

You can see more of LIVE Singapore! on the web site here.