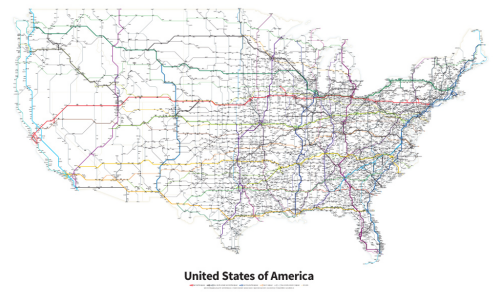
MapCarte 273/365: Highways of the United States of America by Cameron Booth, 2014

MapCarte273_booth

One of the drawbacks of Harry Beck’s fine subway map (MapCarte 1) is that far too many map-makers and designers have relied upon it as a template for their own map. It’s perhaps stifled creativity when we may have seen the next ‘Beck’ emerge instead. Once in a while though, the Beck magic is actually put to good use and Cameron Booth’s one such graphic designer who has worked with the general formula but deployed it meaningfully (sidenote: Booth maintains the informative and detailed Transit Maps Tumblr too). Of course, Beck isn’t his only design cue.

MapCarte273_booth_detail1

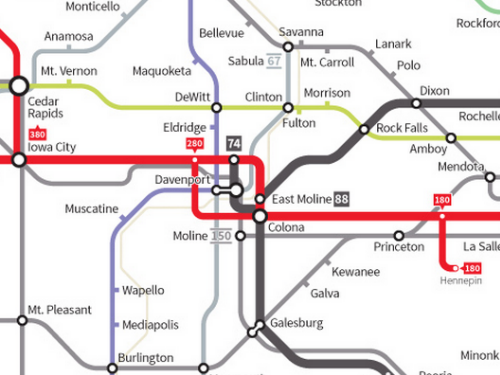
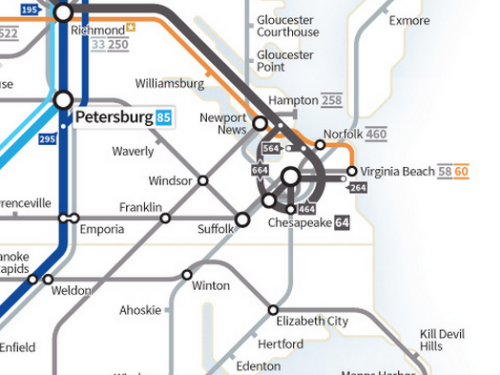
Booth has designed a number of maps in the schematic style but here we highlight his Highway’s of the USA which is the result of a two-year effort to check and codify every current Interstate and Highway. The schematic approach works well but Booth is quite keen to point out that rather than it being seen as a subway map, it’s a simplified road map and that thinking allows us to break loose from the subway metaphor to an extent. The clarity of the map is supported by the simplified linework which uses clean distinguishable colours. Station circles are used for towns and cities that contain an intersection and ticks for places that fall along the road. Places are sized according to their importance in terms of the number of roads that intersect and there are nearly 4,500 place names on the map which given the white space is a monumental achievement in controlling the graphic hierarchy and overall balance of the work.

MapCarte273_booth_detail2

Route naming conventions are systematically applied and again contain a well developed hierarchy and overall the map is a harmonious work that while containing a strong nod to the subway genre makes use of the style and form to support a clear design requirement. The attention to detail is meticulous which illustrates the importance of ensuring every last element of your map is given due consideration. There’s good sense in the maxim that 90% of a map is produced in 10% of the time and the final 10% takes the remaining 90% of time. I don’t know, but I’d wager this sort of balance reflects Booth’s work on this map.

This isn’t just a map that takes a previous design and pours new data onto it. This is a fresh take on the genre and regardless of whatever subway maps have gone before, its form and function are perfectly articulated.

You can read more (and buy prints) about Booth’s map at his blog here.

MapCarte 96/365: OpenCorporates Maps by KILN, 2013

MapCarte96_kilnClick on the image to explore the web map

One of the biggest challenges in cartography is the design of a map that can succinctly illustrate the complex, intertwined nature of connections between similar phenomena. These are typically flow maps between one connected place and another and might show the movement of goods for instance. However, as globalisation continues apace they are increasingly about the interconnectivity of global entities – perhaps not along physical routes but in terms of their relationships to one another. Of course, the larger the geography, the more the content, the bigger the challenge.

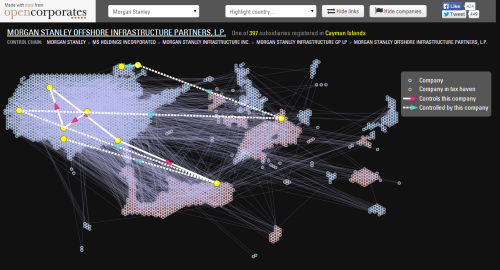
Here, KILN’s challenge was to design a map to illustrate the first global database of all the companies around the world. The data was supplied by OpenCorporates and contained all of the interlinkages from global organisations (which in truth are comprised of a multitude of subsidiaries) down to local businesses. The hierarchical nature of the data lends itself to a tree-like structure though with thousands of entries the design would soon have become too cumbersome both visually and in terms of performance through a web browser. Clustering would also be impractical due to one of the major design headaches for cartographers…detail is often most detailed in the smallest areas. Think urban vs rural differences or, in this case, huge numbers of businesses in relatively small locations like the United Kingdom.

The solution KILN settled on was a cartogram that gave each company a symbol of equal size which were then tesselated, grouped by country, into the shape of that country. The result is a map that clearly shows the relative importance of countries in terms of the quantity of companies they hold (the overall size of the country shape) as well as the density of interlinkages between companies. What works visually also works interactively as each company and country can be isolated to show the parent and children links.

It’s a combination of a cartogram and a schematic map. The shapes are abstract but as a design solution to mapping complexity, using as simple an approach as possible pays dividends.

KILN themselves describe more of the work behind their design on their web site.

MapCarte 79/365: New York City Subway Map by Massimo Vignelli, 1972

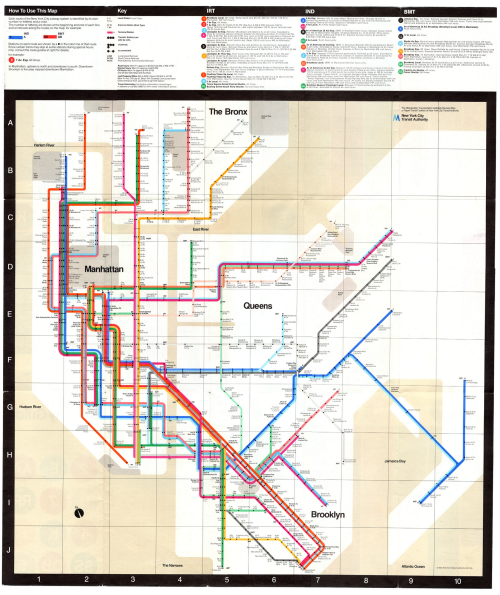
MapCarte79_vignelli

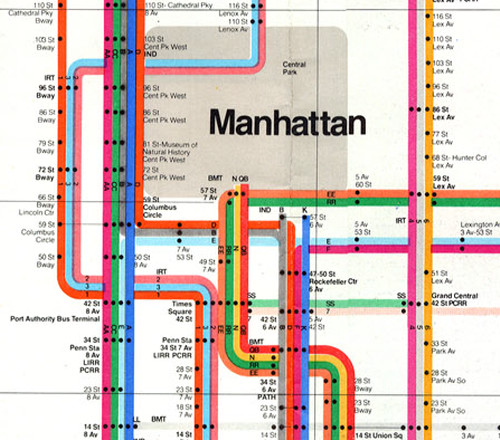
The 1972 map of New York City’s subway system by Massimo Vignelli has often been seen as a polarising map in design terms. For every one person who characterises it as a striking piece of design or commending its beautiful aesthetics, another will point to the geographical liberties it took. These included a square shaped Central Park that might come as a surprise for anyone exiting at 59th Street for a walk only to find the distance horribly distorted. Vignelli’s map only lasted 7 years and was replaced in 1979 with a more topographically correct version that included above ground detail, inter-modal transport links and dramatically thinned linework. This replacement was designed by a committee of 12 people.

The problem, perhaps, lies not with the map, but with the map users. While the London public grew to understand that Harry Beck’s map was grossly distorted yet a perfect solution to navigate from A to B, New Yorker’s simply didn’t appreciate the same approach. Despite the clean, modern lines and bold colours, Vignelli himself explained the issue at a conference in 2010: “I think the real reason is space. But not because Manhattan is too small, it’s because they want to put too much information that doesn’t belong in the diagram. That’s why. All of a sudden there is …and there is no reason. I mean, all you want to know is [how] to go from A to B,”

MapCarte79_vignelli_detail

Like Beck’s map, it was geographically inaccurate by design. Above ground detail was omitted. It was a schematic diagram to support ease of travel through a complex network. Vignelli had been tasked with streamlining the wayfinding task and bringing New York into the future. He succeeded in meeting the design brief yet people eventually reacted by demanding a ‘map’ as they perceived it in the more traditional sense. The replacement, far from being the simplified classic created by Vignelli attempted to overlay multiple disparate layers of information creating a fragmented and unpleasant version. Vignelli’s map was abstract yet provided clear information for the single task at hand.

A classic of cartographic design certainly…but also a classic case of transposing an approach to a new environment and a set of users less inclined to be accepting. Ensuring that a map’s user is satisfied might be considered paramount and so on this basis, Vignelli’s map has remained controversial and may even be considered a classic failure despite its obvious beauty and his good intention.

Vignelli did design a more recent NYC Map for The Weekender…this time a digital version which retained the main components of his original which he still staunchly defends. The digital version can be seen here.

MapCarte 50/365: Web trend map 4 by iA Inc, 2009

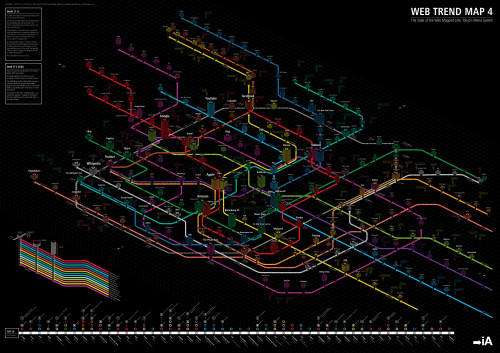
MapCarte50_webtrend

Not the only map of the internet but his well produced schematic maps the most influential internet domains and people onto the Tokyo Metro map. Each domain is assigned to individual stations on the map in ways that complement the characters of each.  Complementary websites are grouped to a line that suits it and the map produces inter-linkages among companies in multiple ways inspiring some intriguing interplay.  For instance, Twitter is assigned the station with the biggest ‘buzz’ and Google is mapped at Shinjuku which is the world’s busiest station.

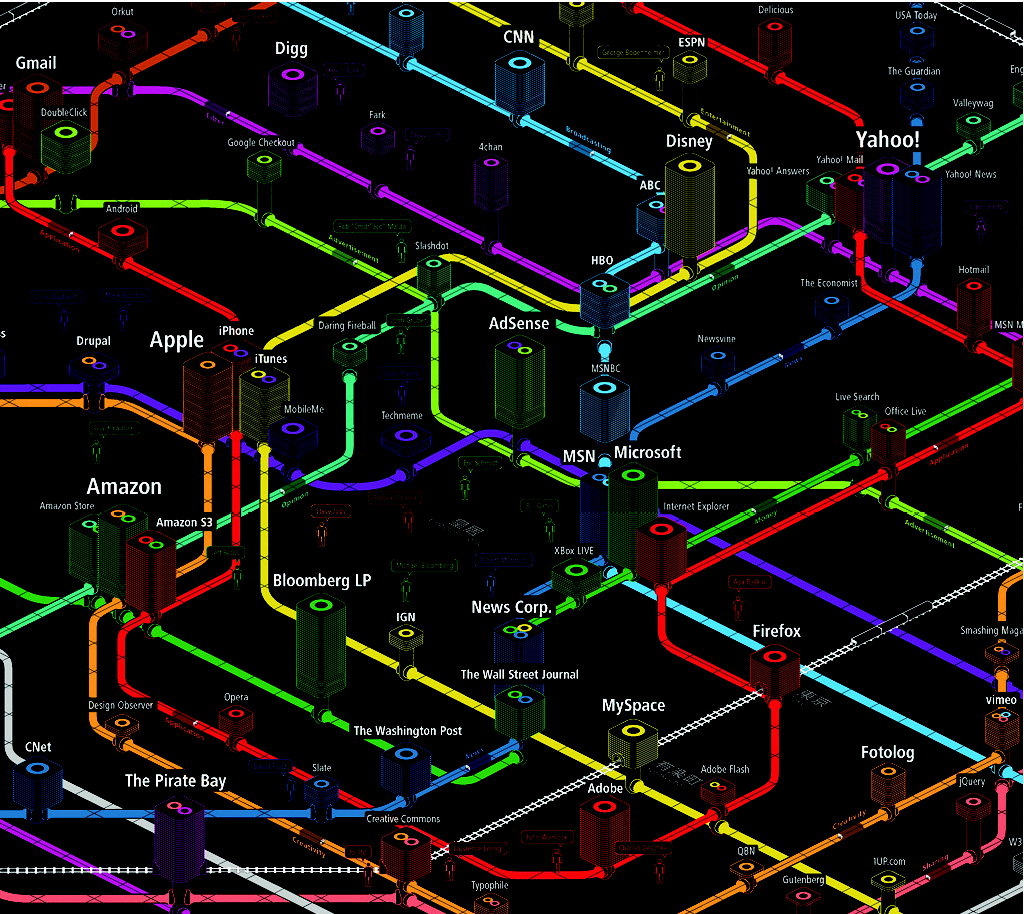
MapCarte50_webtrend_inset

Web domains can be evaluated based on their position (proximity to a main line or hub representing importance), height (success measured in traffic, revenue and media attention) and width (stability as a business entity).  The axonometric gridlines define street level with all subways positioned below the gridded surface.  The Trend Setters are labeled using speech bubbles as if they are saying their name and other labeling works well to support differentiation of major trends.  The colour palette is extraordinarily vivid and works well against pure black.  Why map the internet in this way?  As iA say themselves: because it works.

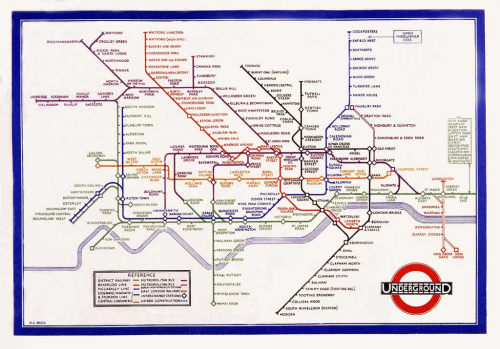
MapCarte 1/365: London Underground Pocket Railways map by Harry Beck, 1933

MapCarte1_Beck

A predictable start for the MapCarte series but let’s get it out the way…my personal favourite. A schematic diagram was Beck’s solution by which to map the London underground for navigation.  It’s a simplified and heavily generalised map consisting of stations, colour-coded straight line segments which run vertically, horizontally or at 45 degree diagonals.  Ordinary stations are differentiated from interchanges; the central area is exaggerated and external areas contracted.  The map shows no relationship to above ground geography other than the River Thames.  The same approach is still in use today by Transport for London, though the map has gone through countless revisions and design changes the core characteristics remain. Beauty in simplicity and a model for many transport related maps to this day.