MapCarte 302/365: The 2002 Australian Total Solar Eclipse by Fred Bruenjes, 2002

MapCarte302_eclipse
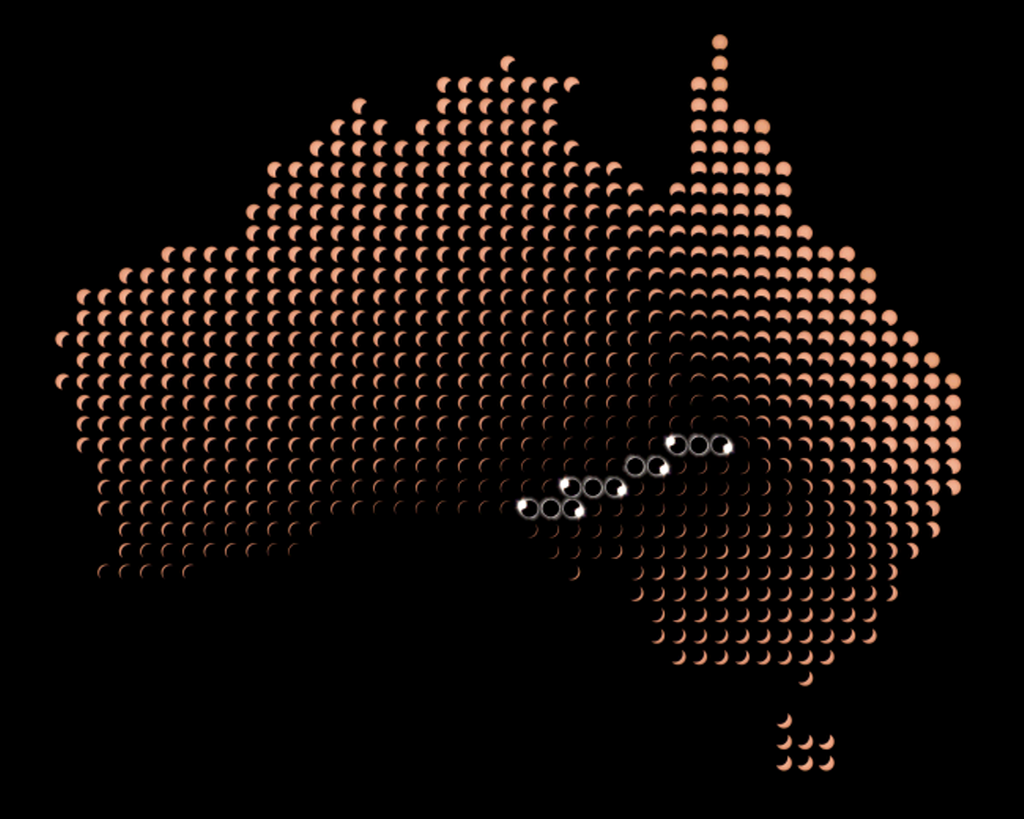
The normal way to set about making a map is to obtain some data that represents the shapes and features of the place you’re mapping and then to generalize, classify and symbolize it to suit your map. You then might overlay some thematic detail…again with heavy doses of processing to capture the essence of your message. You may add some textual components and all sorts of marginalia. WHat happens when you throw all of that out the window and approach the making of your map a different way. That’s exactly what Fre Breunjes did in this map of the 2002 Australian Total Solar Eclipse.

There’s no topographic detail, no thematic detail and no typography. There isn’t even a title! All of this accentuates the map rather than detract from it. Breunjes collected images of the solar eclipse at its maximum taken from various parts of Australia and mosaiced them into a grid of small multiples. A total solar eclipse will be observed as the Moon’s orbit passes between Earth and the Sun and if you are located somewhere near the middle of the shadow. Consequently, as the orbits move, a total solar eclipse will occur along a linear path. Either side of this path you’ll see a partial solar eclipse with less shadow the further away you are.

This beautiful map, then, doesn’t even map anything terrestrial, it maps an astronomical view from that location. The small multiples convey the amount of eclipse seen at each location and the grid of small multiples creates a quite spectacular pattern. Concentrating on the area near total eclipse you can see a variety of patterns that occur during the different phases of contact including the so-called Baily’s Beads and diamond ring effects.

You’d probably not teach a student of cartography to remove every conceivable element of a map in order to make a map yet this example proves that it’s possible. There’s absolutely no need for any other component (except perhaps a title but that’s part of the context in which Breunjes describes the map so it’s not totally absent).

You can see more detail of the maps and a version of the same approach for Africa at Breunjes web site here.

MapCarte 300/365: Historical Atlas of Canada by University of Toronto Press, 1987-1993

MapCarte300_canadaAny atlas project will undoubtedly set out to chronicle a place in detail, attempting to leave no stone unturned in its quest to be a definitive, authoritative statement. Not many atlases actually achieve that almost unattainable level but the Historical Atlas of Canada does. Prepared as a three-volume set of print atlases and published between 1987 and 1993 the detail and execution is breathtaking. These are hand-drawn maps, each of which is a masterpiece in its own right but as a collection gives us a picture of the historical development of Canada that few other countries can similarly point to. The themes you would expect to be covered are all there, presented in rich plates with detail and attention to detail.

MapCarte300_canada1The complexity of creating an atlas like this which demonstrates not only a depth of scholarly activity but a craftsmanship of the highest order is mind boggling. Each map is somewhat innovative in its own way whether it be the use of insets that are used to magnify certain areas, or how smaller areas are sometimes greyed out while a larger version takes precedence, or how 2D is mixed with 3D gridded proportional symbols that aids our interpretation of magnitude. Each map brings something unique to cartography and as much as it acts as a record of Canadian history it should be used as a model of cartographic excellence too.

MapCarte300_canada2The atlas has latterly been made available as an online project and while there’s sense in this because it has the potential to reach many more people, the exquisite nature of the cartography and the way in which turning the pages allows you to interact with the maps in a human way is perhaps lost.

MapCarte300_canada3This is an elegant collection of maps deserving of the status of atlas. It’s a compendium of cartographic delights.

You can browse the online version here.


MapCarte 289/365: The Molucca Islands by Petrus Plancius, 1594

MapCarte289_plancius

Maps have always served a multitude of purposes and supported the great period of trade in the 16th century, particularly for the Portuguese who dominated the Southeast Asian spice trade. When the Dutch wanted to enter the region to support their own trading aspirations they required maps and this map by Petrus Plancius, astronomer and cartographer, became key not only for their trade but also for cartography.

Plancius used maps acquired from the Portuguese and created his map using Mercator’s projection which had to this point found little favour with navigators due to its complex mathematics. By adorning his map with the riches that lay in wait for bold navigators he was able to persuade his map to be used. In many senses it is a persuasive map with the imagery and style evoking a rich bounty of nutmeg, sandalwood and cloves for those who dared.

The map is both a navigational chart and includes rhumb lines and the depiction of shoals and rocky areas but it is also an early example of the use of maps for corporate purposes as it underpinned the development and later success of the Dutch East India Company. Amusingly, despite its scientific basis the map is still embellished with sea monsters to fill in the gaps and for decoration.

A beautiful example of late 16th century copperplate engraved cartography that supports dual purposes and is perhaps one of the most early forms of persuasive cartography.

MapCarte 288/365: Atlas of Canada International Polar Year Map by NRCan, 2008

MapCarte288_circumpolarFitting a map to a piece of paper or a screen is not necessarily the optimum approach to creating a suitable layout. While creating maps of different shapes on a screen is technologically a step too far, when the map is designed for print there remains the opportunity to play with projections and shapes. Here, the Atlas of Canada Program and NRCam illustrate how to handle the shape of a map perfectly. Mapping the North CIrcumpolar region, the region north of 55 degrees latitude, demands an azimuthal projection. Consequently, the map is round rather than the more usual equirectangular maps we tend to see.

The map illustrates national boundaries, Canada’s 200 mile exclusive economic zone as well as the usual toporaphic and reference detail one would associate with a small scale map. The scale of 1:10,400,000 results in a map 1.6 metres in diameter and the impact of such a large map is impressive. Visually, the circular shape immediately invites exploration. Upon closer inspection the drawbacks of a circular shape have been mastered. Typographic placement is a particular difficulty. Horizontal text dowsn’t work on a circular map but ensuring curved text follows an appropriate line is imperative to create harmony. Sometimes type is placed across a curve relating o the landscape but often it follows either lines of longitude as they radiate or lines of latitude when the meridians become too steep up and down the page.

MapCarte288_circumpolar_detail

Colour is well handled, further detail of minimum permanent sea ice extent, the tree line and historical surveyed locations of the Magnetic North Pole from 1831 to 2007 are included to make the map a combination of topographic reference and thematic map. It’s a successful hybrid.

The unconventional format makes perfect sense for the map but brings with it an interesting added dimension that creates interest and reinforces the information portrayed.

The original map (square format) can be downloaded from Natural Resources Canada with additional information here.

MapCarte 284/365: Pizza Geography by Nathan Yau, 2013

MapCarte284_yau1

Thematic maps that display data over a surface normally map counts or rates (think census data…dot density, choropleths etc). Nathan Yau isn’t interested in how many pizza restaurants and take-aways there are near to him. He’s interested in how far away the nearest one is so that any order will get to him in the quickest time (road network and traffic allowing of course). Instead, he calculates which pizza chain has the nearest outlet for a grid, calculated as the nearest place within a 10 mile radius across the U.S.

The map creates a fascinating picture not of totality, because having the ‘most’ number of outlets isn’t necessarily optimum for someone wanting to get their dinner in good time, but of relative accessibility. It’s a simple idea but simple ideas often generate interesting work and he brings a good sense of design and a clean graphical approach to the map too.

He’s used a similar approach to create a tesselated map of burger joints.

MapCarte284_yau2

And has also played with small multiples in looking at the spatial preferences of supermarkets.

MapCarte284_yau3

Exploring datasets using simple thematics is a great way of disentangling the data to eveal particular patterns but these examples show that clear thinking about the specific question you want to answer leads to a clarity in the output too.

There’s more discussion and examples of these maps on Nathan’s FlowingData blog here.

MapCarte 283/365: NYC Noise complaints by Karl Sluis, 2013

MapCarte283_sluis

Abstract looking maps are very often some of those that have the most immediate impact because they look less like maps than, well…maps. They intrigue and reel us in because of their design; their approach; and their graphic aesthetic. These aspects may very well be difficult to define or even describe for a particular map but nevertheless they exist and they go a long way to helping us frame why a map is engaging.

This map (or set of maps within the overall layout) by Karl Sluis depicts the collection and concentration of 311 calls in New York City in 2012. On one hand it’s a graphic art project with minimal but impactful colour, strong shapes that relay the noise concentrations and small multiples that reveal smaller stories within the overall picture.

Yet it remains a map that deconstructs the data in a meaningful way to show us an overall picture using graphics that conotate echoes or pulsing noise waves and then unravels it further to tell micro-stories.

MapCarte283_sluis_detail1

Sluis takes a series of interesting subsets of the data and shows us how they play out across space using individual maps. Here, loud party noise shows concentrations in the Upper East Side as well as parts of lower Manhattan. Other maps reveal interesting pictures of noise associated with construction, buses and noisy dogs. They have a purpose in that they show the complex interplay of noise in an urban setting.
MapCarte283_sluis_detail

Graphically, the maps are clean, sparse and strong in a visual sense. They naturally attract attention and without recourse to any other urban form (roads etc) they clearly show us the gridded structure of the city. The data give us a sense of the city without needing any other forms. They show us how the character of the city changes across time representing residential, commercial and industrial foci at different times. There’s a rhythm that the maps depict, well represented using the visual metaphor of sound waves

You can see more of the map at Sluis web page here and it’s also one of the maps included in the NACIS Atlas of Design II.

MapCarte 279/365: World Atlas of Wine by Littlehampton Book Services, 1971

MapCarte279_wine1

Hugh Johnson’s world alas of wine, publihed by Littlehampton Book Services is a magnificent example of thematic atlas cartography. The numerous pages explore the terroir in a way that had not previously been attempted in such detail. Each page explores the specific local geography of a region and the various wider geographies that impact the wine of that region. For instance, the page here showing Chablis, France, illustrates the topography and differentiates between Chablis, Chablis Premier Cru and Chablis Grand Cru through a pleasing colour scheme. The main map is placed in its regional context and the nice addition of different labels adds to the layout.

MapCarte279_wine2

The maps are simple yet beautiful works of art that explore the fields and vineyards of the different producers. They show clearly the topograpy as well as the local land ownership and production.

MapCarte279_wine3

But the maps are not just topographic; a number explore the geography through 3D block diagrams and alternative representations which bring to life the geography of wine. The atlas is jam packed with maps of all parts of the world though the focus of this first edition is on he main European producers. Later editions give more prominence to the increasing contribution of new world winerys.

A perfect excuse to pour a glass of your favourite wine and then pour over a delightful atlas to explore its origins.

MapCarte 278/365: Socio-economic tectonics by Kenneth Field, 2014

MapCarte278_Field


Forgive the fact it’s one of mine but others feel it worthy of inclusion…

The standard way of illustrating socio-economic data for countries on a world map would be a choropleth. Options, of course, exist, to show data in a different way including proportional symbols or cartograms. All of these techniques are perfectly reasonable but all suffer from one problem, namely that it’s up to the map reader to make visual comparisons between areas shaded differently or symbolised differently. The focus is on how one place compares to another. What if the question is based on trying to understand how similar or dissimilar neighbours are?

This map looks specifically at the relationship between bordering countries to create a set of proportional line symbols that represent their dissimilarity…let’s call it a proportional adjacency map (any better ideas?). It’s a sort of linear cartogram.  Thinner lines mean countries share a very similar value for the variable. Thicker lines mean adjacent countries are very dissimilar. Additional ‘boundaries’ have been added to show how countries differ when they are separated by a stretch of sea or ocean.

MapCarte278_Field_detail


The map shows twenty key socio-economic indicators, four for each of five broad themes. The use of small multiples gives a sense of how different countries vary across different measures. The only colour used on the map simply provides a motif for each of the five themes. Additionally, there is a note for each variable to express which two adjacent countries are most similar, and which are most dissimilar. The title is simply designed to capture attention and provide a metaphor for the socio-economic fracture zones that crisscross the planet.

The style of the map has been deliberately kept subdued so only the coloured fracture zones stand out. It demonstrates that if we’re trying to map a specific characteristic of data that isn’t well supported by conventional techniques then sometimes we have to make a new technique or modify one to suit our purposes. In many ways this map tehnique is the counter to a choropleth and literally fills in the gaps.

You can download a full size print version of the map here.

MapCarte 265/365: O Mapa do Tráfico by Eduardo Asta, 2014

MapCarte265_asta

Occasionally, a map can be tangential to the graphic display…sometimes even a luxury or superfluous in it’s fundamental sense. This scenario tends to happen with very simple data and where a thematic map with no topographic detail is about as detailed as one would need. This example of the global drug trade illustrates this perfectly. The flow lines between regions of origin and consumption are perfectly represented by the lines. The proportional symbology illustrates the mix of drug types. There is little need for the map and it is simply used here for emphasis.

Detail is minimal; and the information could easily have been presented in a series of graphs, yet by using the map Asta has immediately connected people’s view of the trade to places. It is used to good effect since the outline of the world is barely visible and recedes to the background. The vivid colours are visually powerful and the text is there for those wishing to read further, though it’s unnecessary in order to get the idea of the information being presented.

A simple dataset, mapped simply but with good clear design to support ease of use, information recovery and understanding. The map is tangential yet plays a good supporting role.

MapCarte 258/365: Drugged Culture by Stanford Kay, 2010

MapCarte258_druggedThematic maps can often be somewhat bland if the overall layout isn’t considered. Simply getting the construction of a choropleth or proportional symbol map right only goes half way to creating a successful map that draws people in. Combining the theme of the map with symbology that illustrates and connects to the message can lift the map above the mundane. Of course, the context within which the map sits also plays an important part. In a simple, formal report, mapping the most prescribed psychiatric drugs in the USA might need to be plain. As an accompaniment to a magazine article, a newspaper piece or a poster there’s increased license to be more graphically daring.

This map by Stanford Kay makes great use of the shape of the country as a literal container (tray) for different coloured pills. Each different type of pill acts as a series of small multiples and, overall, a cumulative histogram. It creates a cartogram of sorts and provides an attractive illustrative approach to the map which invites people to investigate the detail. The legend is organised to relate to the different drugs and there’s a good amount of information around the map to provide key facts. The title also leans towards something catchy to lure people in and provide a graphical hook.

Overall, simple, colourful and a nice marriage of thematic map and graphic design.