MapCarte 301/365: Berlin by Anon, Ca 1964

MapCarte301_berlinMaps have always been used as propagandist or persuasive documents. People’s implicit trust of a map works in favour of the map maker who may have a particular message to communicate either blatantly or subliminally. During times of conflict it’s also common to see maps used for political gain or to exaggerate either a threat or a relative success in battle to illustrate the threat or to garner support for the cause. The Cold War was no different and maps were produced by all parties that attempted to illustrate a situation to their benefit. Here, a map of Berlin that illustrates the wall, constructed in 1961, might be seen as showing the street network and various features but you don’t have to dig very far to see how the design supports the message.

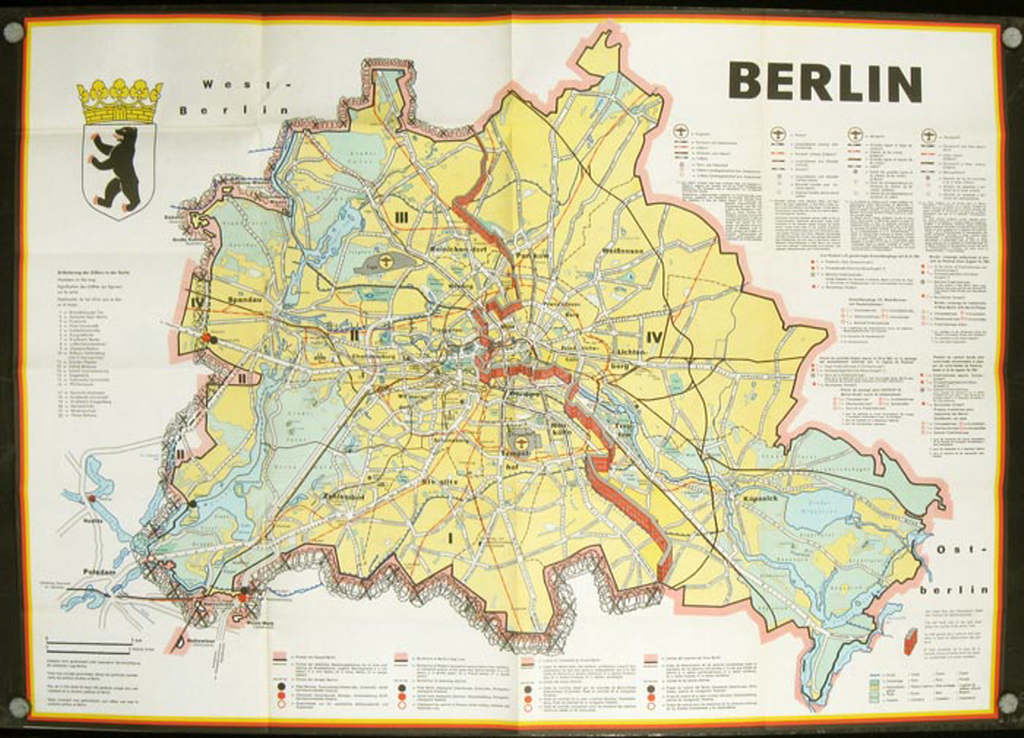
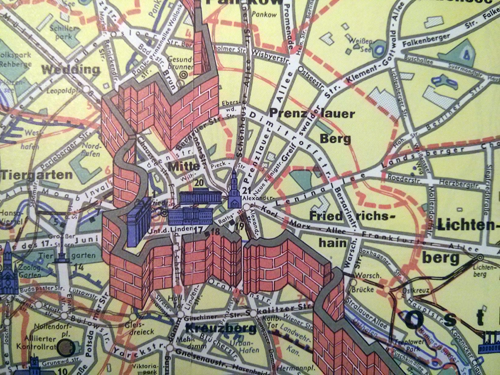
It’s an illustrative map which in it’s own right brings a rather abstract aesthetic to the map which perhaps downplays the real situation. The map shapes the reality of the city with the main element, the wall itself, shown as a dominant wall of red brick slicing its way through the city. The map is planimetric yet the wall is isometric to emphasise it rising from the city, its very height being used to emphasise its function as a barrier. Gates are shown as narrow slices through the wall and in the western part of the map, barbed wire is shown as a further discouragement to anyone who may even think of attempting to get from east to west. Barbed wire encloses the edge of the Western part of the map to make clear the message.

MapCarte301_berlin_detailThe western side is populated with considerable detail whereas the east has very little features and few labels being marked simply as Area IV – East Berlin (which was the Soviet sector). Even the subway lines which are illustrated in detail in the west and which run through the east are shown with stations that are noted as ‘out of service’. The reality was somewhat different – you were not allowed to embark or alight at the stations. There’s even a sense of colour being used as part of the aesthetic with the map border being shown in the flag colours of black, yellow and red.

Of course, this map only tells one side of the story but shows how design can be used to support a particular message. Maps exist that were made for use in East Berlin that showed merely an empty space in the West – a clear message that there was nothing but a void and no particular reason to seek an escape.

MapCarte 300/365: Historical Atlas of Canada by University of Toronto Press, 1987-1993

MapCarte300_canadaAny atlas project will undoubtedly set out to chronicle a place in detail, attempting to leave no stone unturned in its quest to be a definitive, authoritative statement. Not many atlases actually achieve that almost unattainable level but the Historical Atlas of Canada does. Prepared as a three-volume set of print atlases and published between 1987 and 1993 the detail and execution is breathtaking. These are hand-drawn maps, each of which is a masterpiece in its own right but as a collection gives us a picture of the historical development of Canada that few other countries can similarly point to. The themes you would expect to be covered are all there, presented in rich plates with detail and attention to detail.

MapCarte300_canada1The complexity of creating an atlas like this which demonstrates not only a depth of scholarly activity but a craftsmanship of the highest order is mind boggling. Each map is somewhat innovative in its own way whether it be the use of insets that are used to magnify certain areas, or how smaller areas are sometimes greyed out while a larger version takes precedence, or how 2D is mixed with 3D gridded proportional symbols that aids our interpretation of magnitude. Each map brings something unique to cartography and as much as it acts as a record of Canadian history it should be used as a model of cartographic excellence too.

MapCarte300_canada2The atlas has latterly been made available as an online project and while there’s sense in this because it has the potential to reach many more people, the exquisite nature of the cartography and the way in which turning the pages allows you to interact with the maps in a human way is perhaps lost.

MapCarte300_canada3This is an elegant collection of maps deserving of the status of atlas. It’s a compendium of cartographic delights.

You can browse the online version here.


MapCarte 299/365: Oslo Haven by Norwegian Hydrographic Service, 2011

MapCarte299_osloMaps or charts? What’s the difference? Maps tend to show representations of land forms whereas a chart represents the same detail with much greater precision. The reasons are down to the different uses we make of charts, being predominantly for navigation as a working document where the requirement is to plot a course. The need for greater detail and precision of coastlines, obstacles and perhaps hidden obstructions is critical for navigators at sea. Similarly, aeronautical charts also plot very specific details of landscapes in order for aircraft pilots to navigate safely. There simply isn’t the need for such detail on a standard topographic map.

MapCarte299_oslo_detail2Not all charts are created equally though and while the focus for a nautical chart is on the detail at sea that doesn’t mean you can ignore the representation of the land. Getting the balance right on a nautical chart with a limited palette of colours and certain conventions is a challenge but one which the Norwegian Hydrographic Service accomplishes. Here, their 2011 chart of Oslo Harbour demonstrates the clarity they bring to the plotting of detail. The subtle use of blues gives just enough bathymetric information at a glance but there’s a lot of white on the map that gives contrast to the spot depth and other information.

MapCarte299_oslo_detail1They pay particular attention to the land and make use of a palette of buff and sandy colours that give just enough contrast but which doesn’t swamp the map. In this way they have designed the land to complement and not overshadow the main purpose of the map. The linework is crisp and clear and illustrates the best of chart design and production.

MapCarte 298/365: Pin map by multiple people, date unknown

MapCarte298_pinmap

This is a somewhat abstract MapCarte entry in the sense that it doesn’t relate to a specific map, in a specific place or by anyone specific. It’s the sort of map you might find all over the world in various places, made by unknown contributors and whose purpose is also undefined. The physical map of the world, placed on a wall, complete with many map pins stuck in them is a wonderful object and a beautiful piece of collective, cumulative and collaborative design.

Usually found in cafes and coffee shops as a way to demonstrate how such a vendor has a worldly reach, the maps go beyond that objective. They are a physical collection of people, represented in space. The fact that each map pin exhibits a colour suggests a classification of type that simply doesn’t exist. On a conventional map such rainbow colours would cause concern but there’s something unquestioned about the random collection of colours that are positioned across the map.

MapCarte298_pinmap_detailOf course, the areas with densely positioned pins are inevitably those nearest the vendor but that in itself creates a wonderful pattern as people squeeze their contribution onto the map.

Ultimately, these are frivolous maps but which bring delight. We enjoy looking at the maps, each one different yet strangely uniform because they simply show us where people live. In a world of digital cartography it’s pleasing that these personalized renderings still exist. They bring character to many walls and allow us to interact with the map itself, leaving a small mark of where we’ve been to add to those of where everyone is from.


MapCarte 297/365: Canterbury Plains by Irvine International Carpets, 2014

MapCarte297_canterbury1Maps appear in the most unusual places. Our endless fascination with the patterns made by the natural and human landscape are often transferred to all manner of material and used for a wide range of purposes. I saw this example on a recent journey through Canterbury airport, New Zealand. As I wandered through the departure area I naturally thought the patterns on the carpet looked like a map then when you look at the vast expanse rolled out in front of you it becomes obvious it is a map. You are literally walking across a giant abstract map of the Canterbury Plains.

MapCarte297_canterbury4The purpose was to provide visitors to the area with a lasting taste of South Island that mirrored the spectacular views of the Southern Alps from the lounge itself. The carpet has been designed to show the patchwork agricultural shapes of the plains juxtaposed with the rising mountainscape. Satellite imagery was used to re-create the landscape and the carpet is actually a fair representation of the region from Ashburton across the Alps.

MapCarte297_canterbury2In a project such as this it’s as crucial to apply basic tenets of design and omission of extraneous detail such as river beds and buildings enabled the patchwork landscape to emerge. The large textured blocks of colour simulate different crop types to create a dramatic impression. Further, the earth tones actually creates a calming impression in an otherwise hectic environment. As the aircraft takes off you see the landscape for real.

MapCarte297_canterbury3Not so much MapCarte as Map Carpet…with form, material and purpose that takes it beyond a simple artistic endeavour to one that genuinely had intent to create a cartographic experience. On a personal note…I was possibly the only person wandering the lounge taking copious photographs of the floor but I make no apology.


MapCarte 296/365: View of the World from 9th Avenue by Saul Steinberg, 1976

MapCarte296_newyorker

Maps make very evocative and attractive covers for books, magazines and pretty much anything! Done well, they can add a sense of place to say something of the content within. Their composition, density of detail, colours and style often speaks to the audience and will go a large way to attract them to the product. They can be overt marketing tools or they can simply be pleasing on the eye and only later become remembered as something rather unique.

This 1976 cover of The New Yorker is probably instantly recognisable because it holds this special status as a widely viewed ‘classic’ magazine cover. Drawn by Saul Steinberg, the drawing shows the view of the rest of the world from Manhattan (or perhaps an outsiders’ view of New Yorkers’ self image). Unremarkable? Not really. Here is a statement of Manhattan being seen as the centre of the world. It suggests this is the view of the world shared by New Yorkers who know the detail of the centre of their city, just about get to the Hudson River and then see nothing but a vast, rather empty Jersey beyond which is nothing except the Pacific Ocean and China, Japan and Russia on the horizon.

MapCarte296_newyorker_detailIt’s a wonderful illustration that mixes architectural clean lines with typeography that seems an afterthought yet helps the sense of perspective. Steinberg drew many covers and illustrations for The New Yorker of which this is by far the most famous. The proportions of the page used for Manhattan vs the rest of the world and the width of the Hudson River compared with the Pacific are not accidental. The rest of the world is shown about the size of three city blocks. The Pacific is narrower than the Hudson. The ‘Jersey’ label is shown in bold compared to the rest of the labels beyond the river. These are very deliberate design decisions that reinforce the overall message. They are subtle ways in which as an artist Steinberg can shape the way people view the map and form their image.

This is also how cartographers can shape their work with subtle modifications to the design, placement and style of map elements that promote, demote and reinforce a message.


MapCarte 295/365: 7.5 minute Quadrangle sheets by USGS, 1945-1992

MapCarte295_quad7_5

National Mapping Authority topographic map series have been the bread and butter of many nations. Each has developed a unique style and brought a particular sense of design to their map sheets. Many of us have grown up with a love of our own national maps having used them in school and on holidays. They become familiar and known. We understand the symbology, the scales and the look and feel they bring to our understanding and appreciation of the environment. We featured one such mapping series by Great Britain’s NMA, Ordnance Survey, in MapCarte 30. Here we focus on the famous quadrangle maps from the United States, specifically the large-scale 7.5 minute series.

The United States Geological Survey (USGS) largest (in terms of scale and quantity) and best-known map series is the 7.5-minute or 1:24,000 quadrangle series.  The scale is unique in national mapping being related to the measurement of 1 inch to 2000 feet.  Each of nearly 57,000 maps is bounded by two lines of latitude and longitude covering 64 square miles in southern latitudes but, due to convergence of meridians, only 49 square miles in northern latitudes.  The specification has been applied to many other geographies that the US mapped during military operations which demonstrates a high level of flexibility and versatility in the design.


The example we show here is the Alton Quadrangle (195) that covers part of the Ohio River on the Indiana/Kentucky border. It shows the balanced composition of the sheets perfectly as it encompases considerable elevation change depicted with the signature orange-brown contours as well as the forestry and water bodies.

MapCarte295_quad7_5_detail
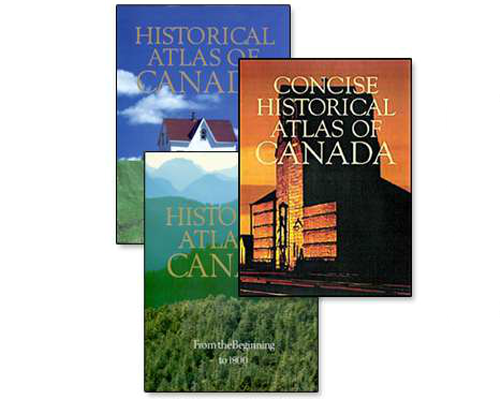
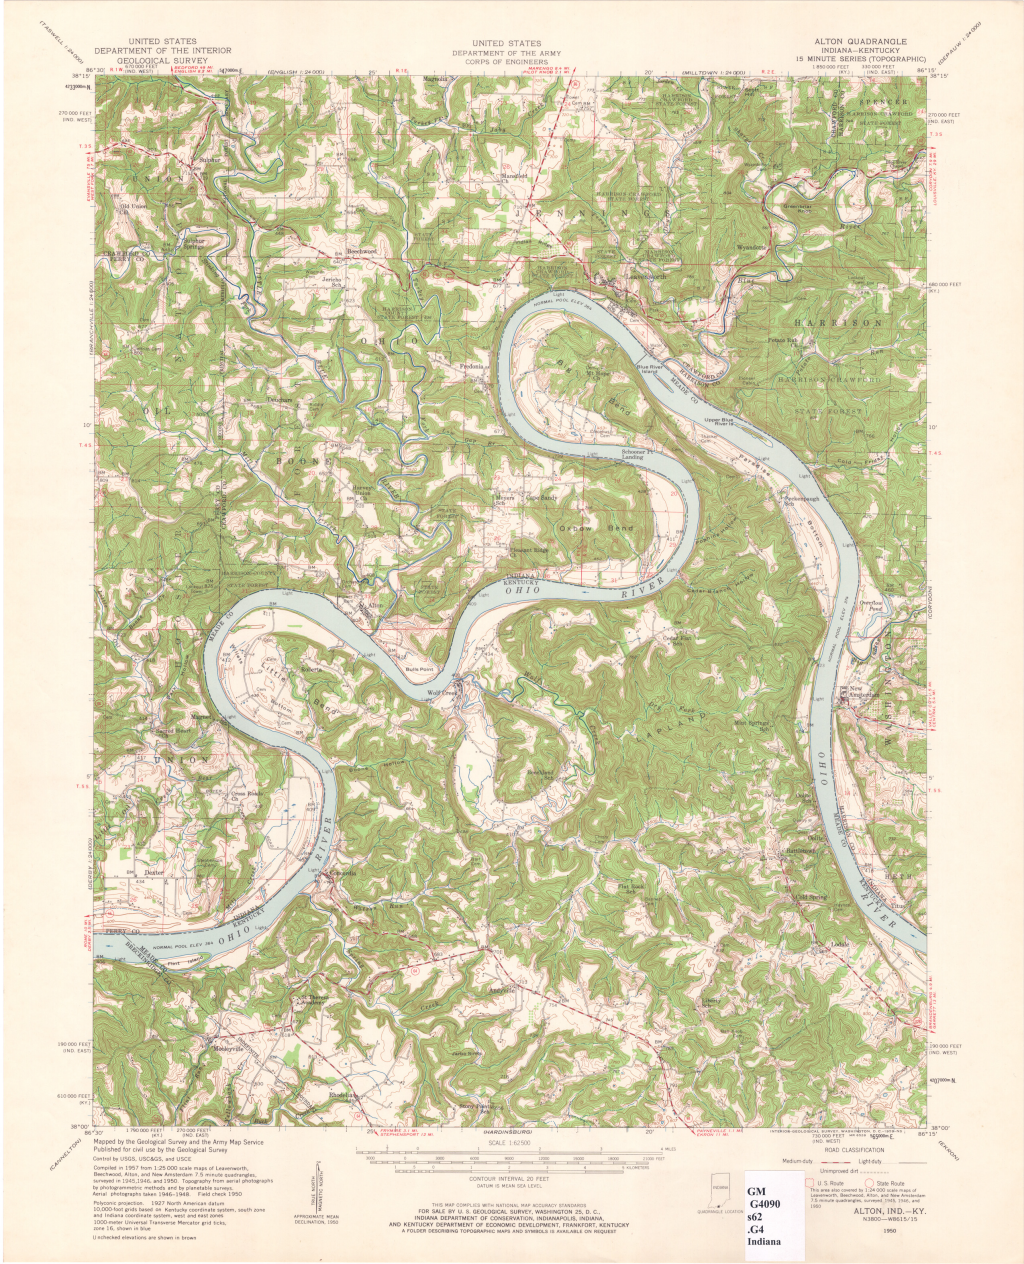
As a brand, the series is instantly recognizable and successful.  The content serves both civilian and military purposes and supports varied usage.  Marginalia is well structured and complex information delivered in a succinct, well organised manner.  The series was officially completed in 1992 and while The National Map (http://nationalmap.gov/ustopo/) represents a new generation of digital products the impact of the originals persists with new maps arranged in the 7.5-minute quadrangle format as well as retaining the same look and feel.

MapCarte 294/365: NYC Street Maps by Andy Warhol, 1949 & 1954

MapCarte294_warhol1

Mapping is not just for cartographers. Many of the very best maps have been made by people that have little formal education in cartography or, even, many examples to their name. What they achieve is the ability to bring a fresh perspective to a specific theme and a perfect storm provides the conditions in which their map is produced. Of course, this is the exception rather than the rule and a cartographer will likely hit the mark more often than a non-cartographer. If we’re looking for design ideas and cues in mapping that helps us see the world in a different way then perhaps looking at purely artistic endeavor is one way we can imbue a more artistic temperament in our work. We explored one example in MapCarte 3 with ‘Map’ by Jasper Johns.

Here, we show perhaps pop art’s greatest exponent experimenting with the map. Andy Warhol, perhaps best known for his self portraits, bananas, Campbell’s soup cans and pictures of celebrities turned his attention to the map in these two works, both of Central Park, New York in 1949 and 1954. Like most art, it’s really up to the viewer to interpret them as he or she wishes. In many ways they are whimsical, almost incidental works that might have taken very little time to draw and paint. But their beauty lies in their simplicity.

MapCarte294_warhol2While slightly different in style and method, both maps contain simple shared characteristics. Both focus on Central Park. Both contain a clarification of east and west, one as labels across the map, one as a compass rose. Both contain simple representations of some streets; stylized buildings simply to represent existence rather than form; and the rivers are symbolized to border Manhattan island. They each contain the very basics of what a map is…scale, orientation, context, symbols and a focus.

The more you study these examples the more you see…the lack of a line to represent the coast, the use of colour to demarcate land, the systematic tree symbols, the orientation of some of the buildings in aspect to align with the road, and the isometric buildings in the later example.

Despite the apparent simplicity of the work, there are many cues Warhol has taken from more traditional maps. He’s woven them into art that represents the map but which allows us to see how the map itself can be deconstructed.


MapCarte 293/365: Atlas of infectious diseases by Oregon State University, 2014

MapCarte293_healthatlas

Most web maps tend to be based on a single theme. They exist behind a URL and they rarely sit in a context. We visit the map, we see it, we leave it. There are few products that have attempted to compile a digital set of maps into a coherent atlas and presented as an application. The atlas of infectious diseases does just that and is all the more remarkable because it was designed and produced as a student project at Oregon State university.

The atlas is designed for the iPad as a downloadable app (though a static version containing the maps is also available as a PDF download). The atlas showcases a range of infectious diseases using strong graphics, designed for digital display with simplified map shapes, bare basemaps and highly contrasting thematic overlays. These maps are designed to communicate quickly and efficiently.

MapCarte293_healthatlas_cholera

The maps hang together as a coherent whole even though they show distinct subject matter. their use of colour goes a long way to ensuring continuity across the pages. navigation is intuitive and there is a good use of supplementary graphical material and textural components.

MapCarte293_healthatlas_ebolaThe map types vary enough to maintain interest but never as a way of simply creating unnecessary differences. the map types support each theme well. The atlas builds a strong picture of the history of infectious disease as well as a contemporary assessment.

Design of digital atlases needs a different mindset than that of a more comprehensive print version. They need to be simpler in terms of the complexity of visuals (though not simplistic), contrast needs to be well managed across each page and there needs to be sufficient interest to encourage people to ‘turn the page’. As an exercise in creating a modern cartographic product it’s perfect for student engagement. What we have here is a benchmark for how students can design and produce a high quality product using modern design and authoring tools.

More details can be found at the atlas web site here.


MapCarte 292/365: The Ways of the Framers by Daniel Huffman, 2011

MapCarte292_framers

Typographic maps have become rather popular in the last few years as many different cartographers and map-makers have sought to create a map based entirely of typographic elements. MapCarte has featured a number of these (e.g. Irish Surnames MapCarte 76, Axis Maps Mapcarte 179) because they showcase a different approach to design and communication. Here, Daniel Huffman has created a beautiful historic looking map that recreates the street network of Madison, Wisconsin using the street names.

This sort of approach might be somewhat ordinary for many towns but here is a case of the map content providing detail that elevates the end product to something rather different. The street names have meaning as they are all based on the signers of the U.S. Constitution, so named by James Doty when the street network of Madison was laid out in 1836. The map, then, not only provides a depiction of the names but also a link to history of the city and the country.

MapCarte292_framers_detailHuffman goes further than simply using an historic looking font though – he traced scanned copies of the signatures from the Constitution document itself and shapes the street network accordingly. The mix of size, style and colour gives the map a sepia appearance and creates interest. The signatures add personality to the map and provide a link to the individuals themselves. Each street takes on something of the personality of the signatory and gives it a sense of belonging. It creates distinct patterns and makes each street unique where, conventionally, we’d use standard typeface and treatment to secure uniformity. Huffman shows us that by breaking the rules we can create something both different and meaningful.

As Huffman himself notes the map “aims to reconnect Madison’s modern citizens with the people their city was intended to memorialize”. The design fits that objective, creating not only a lasting memorial but also a beautiful cartographic product.