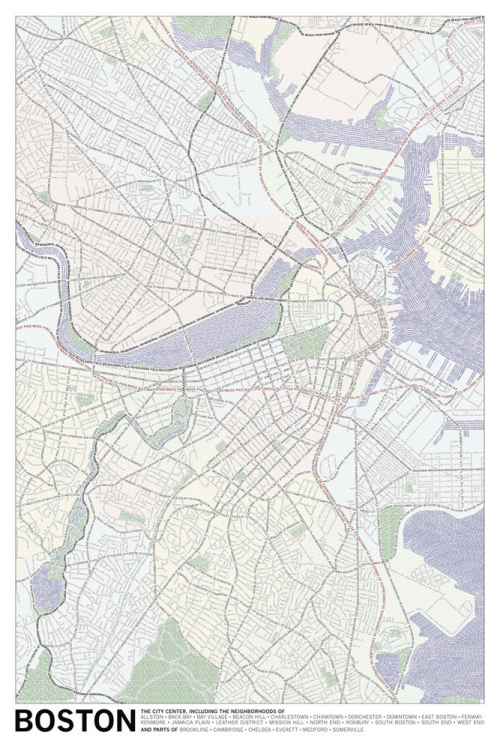
Typography is more commonly used on the map as a literal symbol simply to add context to features that are symbolised using other graphics. We also see a lot of maps where typography is used both as a locative, quantitative and literal symbol combined. Such maps might contain proportionally scaled labels that are located to indicate a specific feature. Often there are no other graphics and the maps have a certain aesthetic appeal.
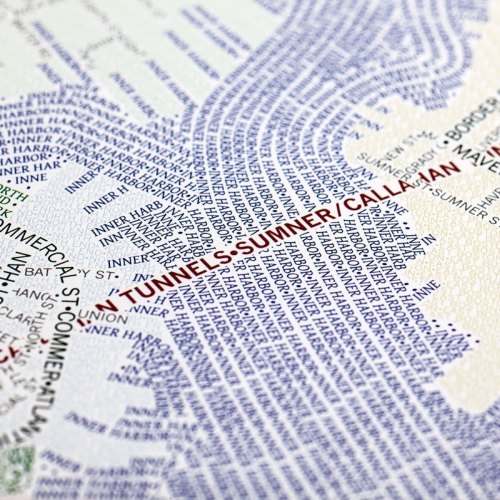
Here, Axis Maps take a slightly different approach by using typography to build the form of a planimetric map itself. The labels that might otherwise be shown once on a standard reference map are now used as a repeated shape to give form to a larger feature. Linear features contain an array of repeated labels and areas use labels as a pattern fill.
Colour is also used to accentuate the difference between features so we typically see labels that indicate water shown in blue and roads in black. Green spaces are in…green. The overall effect is very appealing both at a distance where structure can be easily seen or close-up where the individual labels can be distinguished.
The maps were produced by manually positioning each letter. While automated label placement is now advanced enough to handle most cartographic jobs to a high standard, this is more of an artistic approach to labelling and requires considerable manual adjustment to get the look and feel just right.
More details and different cities are available on the Axis Maps web site here.


