MapCarte 294/365: NYC Street Maps by Andy Warhol, 1949 & 1954

MapCarte294_warhol1

Mapping is not just for cartographers. Many of the very best maps have been made by people that have little formal education in cartography or, even, many examples to their name. What they achieve is the ability to bring a fresh perspective to a specific theme and a perfect storm provides the conditions in which their map is produced. Of course, this is the exception rather than the rule and a cartographer will likely hit the mark more often than a non-cartographer. If we’re looking for design ideas and cues in mapping that helps us see the world in a different way then perhaps looking at purely artistic endeavor is one way we can imbue a more artistic temperament in our work. We explored one example in MapCarte 3 with ‘Map’ by Jasper Johns.

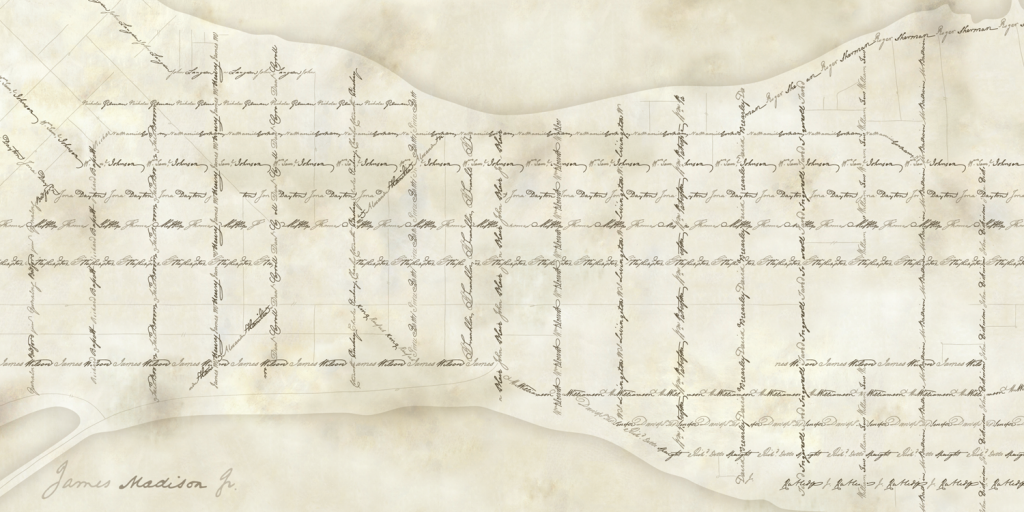
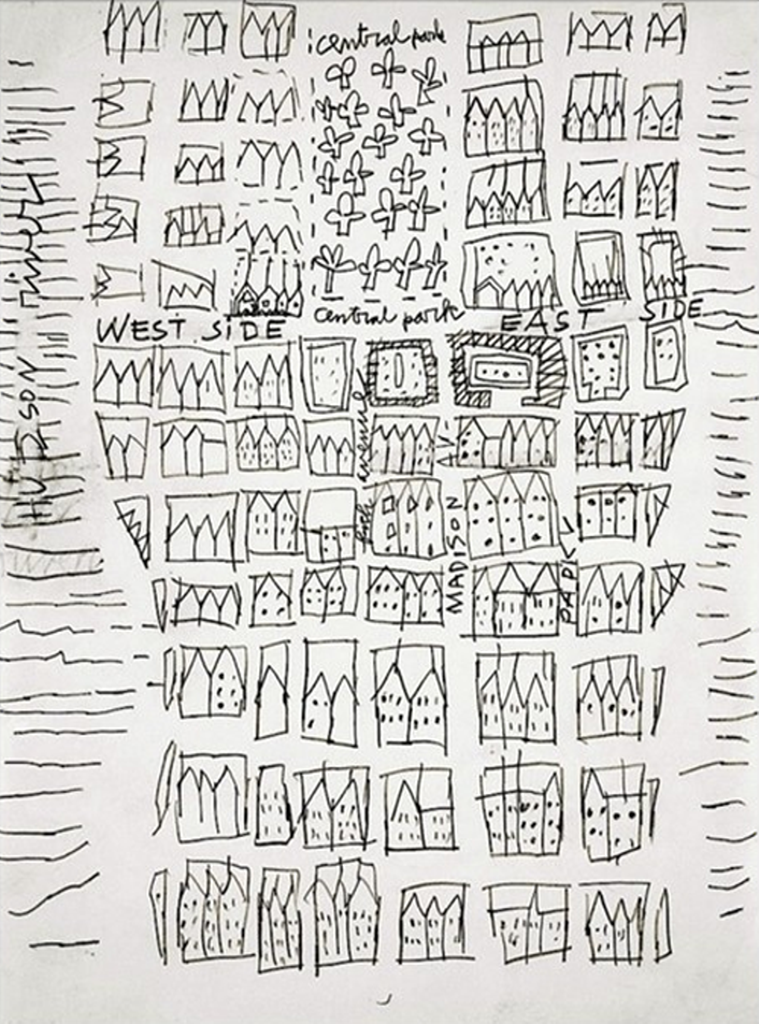
Here, we show perhaps pop art’s greatest exponent experimenting with the map. Andy Warhol, perhaps best known for his self portraits, bananas, Campbell’s soup cans and pictures of celebrities turned his attention to the map in these two works, both of Central Park, New York in 1949 and 1954. Like most art, it’s really up to the viewer to interpret them as he or she wishes. In many ways they are whimsical, almost incidental works that might have taken very little time to draw and paint. But their beauty lies in their simplicity.

MapCarte294_warhol2
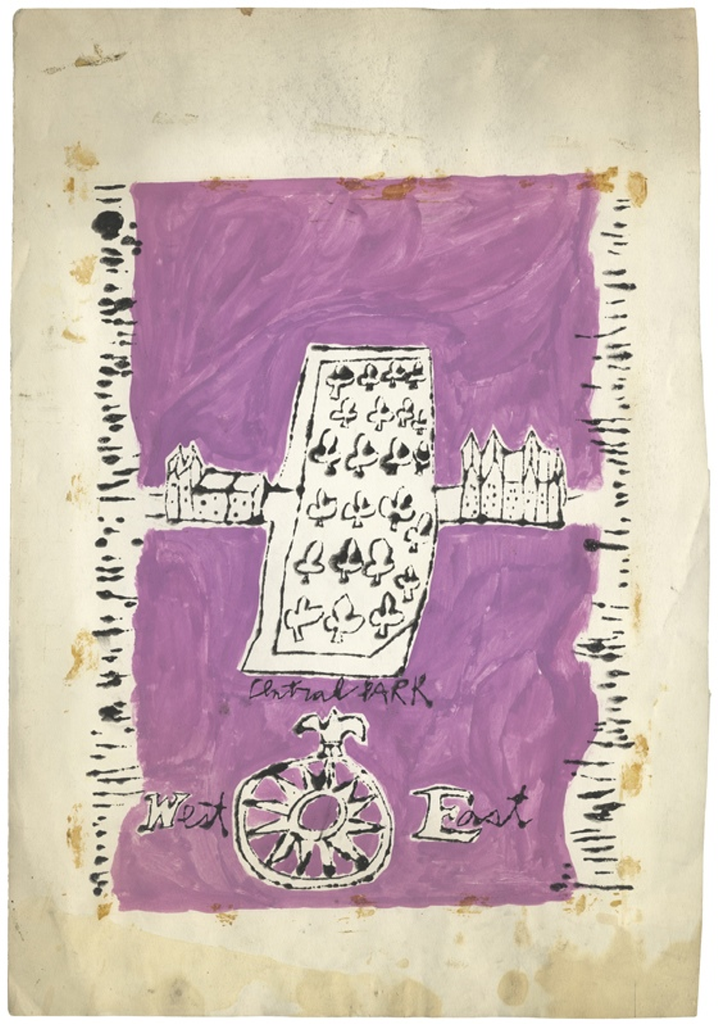
While slightly different in style and method, both maps contain simple shared characteristics. Both focus on Central Park. Both contain a clarification of east and west, one as labels across the map, one as a compass rose. Both contain simple representations of some streets; stylized buildings simply to represent existence rather than form; and the rivers are symbolized to border Manhattan island. They each contain the very basics of what a map is…scale, orientation, context, symbols and a focus.

The more you study these examples the more you see…the lack of a line to represent the coast, the use of colour to demarcate land, the systematic tree symbols, the orientation of some of the buildings in aspect to align with the road, and the isometric buildings in the later example.

Despite the apparent simplicity of the work, there are many cues Warhol has taken from more traditional maps. He’s woven them into art that represents the map but which allows us to see how the map itself can be deconstructed.


MapCarte 293/365: Atlas of infectious diseases by Oregon State University, 2014

MapCarte293_healthatlas

Most web maps tend to be based on a single theme. They exist behind a URL and they rarely sit in a context. We visit the map, we see it, we leave it. There are few products that have attempted to compile a digital set of maps into a coherent atlas and presented as an application. The atlas of infectious diseases does just that and is all the more remarkable because it was designed and produced as a student project at Oregon State university.

The atlas is designed for the iPad as a downloadable app (though a static version containing the maps is also available as a PDF download). The atlas showcases a range of infectious diseases using strong graphics, designed for digital display with simplified map shapes, bare basemaps and highly contrasting thematic overlays. These maps are designed to communicate quickly and efficiently.

MapCarte293_healthatlas_cholera

The maps hang together as a coherent whole even though they show distinct subject matter. their use of colour goes a long way to ensuring continuity across the pages. navigation is intuitive and there is a good use of supplementary graphical material and textural components.

MapCarte293_healthatlas_ebolaThe map types vary enough to maintain interest but never as a way of simply creating unnecessary differences. the map types support each theme well. The atlas builds a strong picture of the history of infectious disease as well as a contemporary assessment.

Design of digital atlases needs a different mindset than that of a more comprehensive print version. They need to be simpler in terms of the complexity of visuals (though not simplistic), contrast needs to be well managed across each page and there needs to be sufficient interest to encourage people to ‘turn the page’. As an exercise in creating a modern cartographic product it’s perfect for student engagement. What we have here is a benchmark for how students can design and produce a high quality product using modern design and authoring tools.

More details can be found at the atlas web site here.


MapCarte 292/365: The Ways of the Framers by Daniel Huffman, 2011

MapCarte292_framers

Typographic maps have become rather popular in the last few years as many different cartographers and map-makers have sought to create a map based entirely of typographic elements. MapCarte has featured a number of these (e.g. Irish Surnames MapCarte 76, Axis Maps Mapcarte 179) because they showcase a different approach to design and communication. Here, Daniel Huffman has created a beautiful historic looking map that recreates the street network of Madison, Wisconsin using the street names.

This sort of approach might be somewhat ordinary for many towns but here is a case of the map content providing detail that elevates the end product to something rather different. The street names have meaning as they are all based on the signers of the U.S. Constitution, so named by James Doty when the street network of Madison was laid out in 1836. The map, then, not only provides a depiction of the names but also a link to history of the city and the country.

MapCarte292_framers_detailHuffman goes further than simply using an historic looking font though – he traced scanned copies of the signatures from the Constitution document itself and shapes the street network accordingly. The mix of size, style and colour gives the map a sepia appearance and creates interest. The signatures add personality to the map and provide a link to the individuals themselves. Each street takes on something of the personality of the signatory and gives it a sense of belonging. It creates distinct patterns and makes each street unique where, conventionally, we’d use standard typeface and treatment to secure uniformity. Huffman shows us that by breaking the rules we can create something both different and meaningful.

As Huffman himself notes the map “aims to reconnect Madison’s modern citizens with the people their city was intended to memorialize”. The design fits that objective, creating not only a lasting memorial but also a beautiful cartographic product.

MapCarte 291/365: SplashMaps by David Overton, 2012

MapCarte291_splashmaps

Wearables are currently the supposed next big thing in technology. Every self-respecting tech-company is rapidly prototyping and releasing glasses, watches and all manner of products that offer us ways to measure, log and track everything we do. We can’t stop this sort of progress and at some point someone will work out the benefit of all this wearable technology but until then, we can simply reflect on a different type of wearable…the map.

Frustrated by inaccurate GPS devices and the obvious problem of paper maps getting wet, David Overton set about creating a product, using Kickstarter funding, that is a simple yet ingenious design – a map printed on an indestructable material. The design here is to create the product in a form that supports the function. Traditional map products have never developed with outdoor use in mind and suffer the insults of wind, rain and mud…as do electronic navigation devices (which additionally suffer battery drainage and screen glare). overton’s absurdly simple idea marries the engineering of a product that works well in the outdoor environment, based on data that can be licensed or sourced easily, and printed with modern technologies that maintain clarity.

MapCarte291_splashmaps_detail

The maps over 34 different areas of Great Britain (at the time of writing) and there is also a personalised service. they are waterproof, tearproof and can withstand being handled roughly. They can also be written on and are washable so after getting the map in a mess it can be thrown in the washing machine and be brought back to its pristine best.


MapCarte291_splashmaps_detail2The idea of printing maps onto fabric is perhaps not a new one but this product certainly is. It’s design sits at the perfect confluence of form and function, delivering modern mapping to the outdoor enthusiast in a way that supports their activities 100%. Since coming to market SplashMaps have won a number of awards for both innovation and cartography.

More details at the SplashMaps web site here.


MapCarte 290/365: Map of the Island of Peurto Rico by Alvarado Dominguez, 1935

MapCarte290_peurtoricoThe aesthetics of a map usually have much to do with the relationship of form and function. Those that combine elements coherently, harmoniously and with purpose might be said to be displaying graphical eloquence. Then there are the maps whose form is so arresting that it trancends the function…or at least overrides it. This map by Dominguez from 1935 might fall into this category. The content is fairly typical of a medium-small scale product showng topographic detail of Peurto Rico. It’s a well crafted map in these terms but it’s the look and feel of the map that draws attention.

If you look at the map and think ‘blueprint’ you’d be correct. The map has been printed using cyanotype, a photographic printing process which creates the classic cyan-blue image we normally associate with architectural drawings – blueprints. The process was used extensively in the early 20th century because it was a low cost method of producing copies using chemicals that, when reacted as part of the photo-mechanical process produce an insoluble blue dye. The traditional blueprint is, effectively, a negative image with the brighter areas being those exposed and resulting in the linework and lettering.

MapCarte290_peurtorico_detail

Additional colours are added by hand but as a way of creating multiple copies of a map it provided an effective solution. In design terms, the authors had to be careful to ensure detail was of a suitable density since the map was effectively two colour and all linework and text sharing the same light tone. Different thicknesses of linework gives the map its visual heirarchy.

The look and feel of the map is one that immediately invites inspection and generates interest. A practical approach to managing costs but which creates an entirely unique map.

MapCarte 289/365: The Molucca Islands by Petrus Plancius, 1594

MapCarte289_plancius

Maps have always served a multitude of purposes and supported the great period of trade in the 16th century, particularly for the Portuguese who dominated the Southeast Asian spice trade. When the Dutch wanted to enter the region to support their own trading aspirations they required maps and this map by Petrus Plancius, astronomer and cartographer, became key not only for their trade but also for cartography.

Plancius used maps acquired from the Portuguese and created his map using Mercator’s projection which had to this point found little favour with navigators due to its complex mathematics. By adorning his map with the riches that lay in wait for bold navigators he was able to persuade his map to be used. In many senses it is a persuasive map with the imagery and style evoking a rich bounty of nutmeg, sandalwood and cloves for those who dared.

The map is both a navigational chart and includes rhumb lines and the depiction of shoals and rocky areas but it is also an early example of the use of maps for corporate purposes as it underpinned the development and later success of the Dutch East India Company. Amusingly, despite its scientific basis the map is still embellished with sea monsters to fill in the gaps and for decoration.

A beautiful example of late 16th century copperplate engraved cartography that supports dual purposes and is perhaps one of the most early forms of persuasive cartography.

MapCarte 288/365: Atlas of Canada International Polar Year Map by NRCan, 2008

MapCarte288_circumpolarFitting a map to a piece of paper or a screen is not necessarily the optimum approach to creating a suitable layout. While creating maps of different shapes on a screen is technologically a step too far, when the map is designed for print there remains the opportunity to play with projections and shapes. Here, the Atlas of Canada Program and NRCam illustrate how to handle the shape of a map perfectly. Mapping the North CIrcumpolar region, the region north of 55 degrees latitude, demands an azimuthal projection. Consequently, the map is round rather than the more usual equirectangular maps we tend to see.

The map illustrates national boundaries, Canada’s 200 mile exclusive economic zone as well as the usual toporaphic and reference detail one would associate with a small scale map. The scale of 1:10,400,000 results in a map 1.6 metres in diameter and the impact of such a large map is impressive. Visually, the circular shape immediately invites exploration. Upon closer inspection the drawbacks of a circular shape have been mastered. Typographic placement is a particular difficulty. Horizontal text dowsn’t work on a circular map but ensuring curved text follows an appropriate line is imperative to create harmony. Sometimes type is placed across a curve relating o the landscape but often it follows either lines of longitude as they radiate or lines of latitude when the meridians become too steep up and down the page.

MapCarte288_circumpolar_detail

Colour is well handled, further detail of minimum permanent sea ice extent, the tree line and historical surveyed locations of the Magnetic North Pole from 1831 to 2007 are included to make the map a combination of topographic reference and thematic map. It’s a successful hybrid.

The unconventional format makes perfect sense for the map but brings with it an interesting added dimension that creates interest and reinforces the information portrayed.

The original map (square format) can be downloaded from Natural Resources Canada with additional information here.

MapCarte 287/365: City of Pop by Designliga, 2014

MapCarte287_pop

Fictional maps continue to occupy a growing genre in cartography through the increase in the use of fictional worlds in film and gaming. It’s not entirely new in the sense that literary works have long used fictional maps as part of the setting of their story (for instance Treasure Island in MapCarte 36, 100 Aker Wood in MapCarte 14 and The worlds of J. R. R. Tolkein in MapCarte 247). Music, also has seen imaginary worlds devised to tell something of the culture and circumstances such as the Manchester Music Map featured in MapCarte 205. Here, a German radio station, working with design firm Designliga, has created a fictional music map as a celebration of their station and the music it has championed since it hit the airwaves.

An earlier version of the City of Pop map was created in 2009 to celebrate the station’s 30th anniversary. This 2014 version is in celebration of their 35th anniversary and as a cartographic product in print and on the web provides listeners with something additional. As a print map it works well as a promotional device for the station more than anything. There is also a zoomable online version that allows deeper exploration of the map’s detail

MapCarte287_pop_detail2

The map is hand drawn in detail and showcases the history of pop culture. The design goal was to illustrate the history of music in a form other than the written word or a magazine article. The imaginary city metaphor allows interconnections to be brought to life. For instance ‘Depeche Mode Midway’ separates the pop district from the new wave quarter and the Bryan Ferry sails down the Mainstream River. The map is not devoid of satire either as Michael Jackson has been erected as a monument in the heart of the pop district but with his face obscured by scaffolding.

MapCarte287_pop_detail1

The map contains over 1300 streets and 500 places with a timeline printed verso. The main design motif is an electric guitar whose strings appear as railway lines entering a station. This isn’t a normal city though great care has been taken to combine musical imagery and references into a believable landscape.

It’s a fascinating and engaging way to present information that would otherwise be seen in a less visual form. It illustrates the versatility of the map to act as a canvas on which people can create fantastic illustrations of even the most non-spatial phenomena.

You can view the online version here and more on the map’s concept by Designliga here.

Survey into colour design – participation request

Our colleagues at the University of Zurich, led by Professor Sara Fabrikant, are undertaking a fascinating study into the use of colours for displaying complex data – an issue that resonates with many of the basic tenets of map design.

If subscribers to the ICA Map Design Commission could spend a few minutes (15-20) by way of participating in a survey this would greatly help the research endeavor.

You can find the survey here.

Thanks.

MapCarte 286/365: Kii – Kinki 360° panorama map by Masaki Oda, 2009

MapCarte286_kinki

Japanese cartography is renowned for the quality and craftsmanship of their panoramas. The detail is exquisite and the scenes are so well framed with not only landscape but, often, a narrative of and contained within the vista itself. This beautiful example from the studio gTonbi-eye by Masadi Oda is in a full 360 degree perspective and depicts the landscape of the Kii peninsula near the centre of the Japanese islands.

As an area that receives large annual rainfall measures there is a lot of dense natural forest so the image is predominantly green though there are diverse landscapes revealed with plains, mountains and basins on view.

MapCarte286_kinki_detail1

To the north is the city of Kyoto but the impressive design characteristic of this work is the combination of such a macro-level image but which also allows the reader to view the micro detail of different urban or rural regions. Creating a map that supports these tow very different scales and views is impressive. The maps are made by hand which makes their design all the richer since every stroke has been thought through and carefully applied. There’s no analytical work involved to apply equal treatments across similar data types which has the result of making each component just that bit different.

MapCarte286_kinki_detail2

The mountainscapes are shown predominantly as aspect molehills but with a carefully applied hillshade to give added depth. The outlining of each mountain ridge in a darker colour wouldn’t be seen naturally but gives each mountain a presence and clarifies the image. At over 3 metres in length if you wrapped the map around you and stood in the centre you would genuinely see the landscape.

MapCarte286_kinki_detail3Finally, the author has added some realistic haze effects so that distant features seem subdued in comparison to the foreground. Our eyes are naturally accustomed to this in the real world and the map mimics it and makes the reader feel at ease. Even Mt Fuji makes a distant appearance in the distant haze.

Rich in detail, colour and thinking.