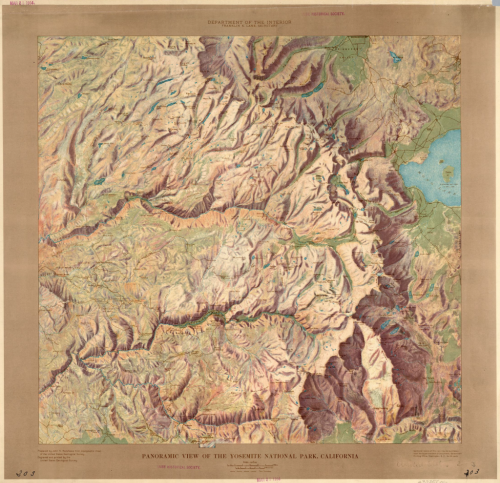
MapCarte 259/365: Yosemite Valley by John H, Renshawe, USGS, 1914

MapCarte259_yosemite

As more and more maps are created by digital means it’s easy to forget that many digital techniques still fail to achieve the artistry that a hand drawn map can bring to bear. Cartography has always been heavily populated by artists who have brought considerable graphical skill to the process of design and production but as we search for ever more automated techniques that more people can deploy we perhaps lose a little of that exceptional individual work. Hand drawn maps bring a style that can be as different and unique as a Monet to a Van Gogh or a Turner to a Banksy.

Here, John Renshawe shows us a rich palette of colour with deep browns and earth tones to depict Yosemite Valley. Lush greens and bright blues complement this excellent colour scheme that attempts to show the landscape as rich as one might find it in reality.
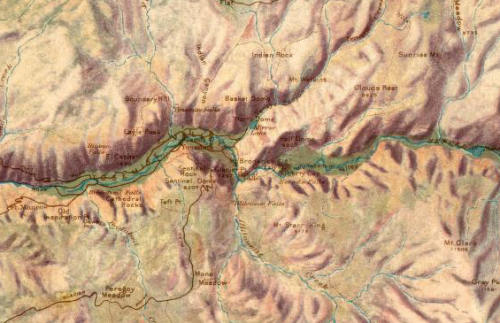
MapCarte259_yosemite_detailThe manually developed hill shade is particularly striking and though analytical hillshades have advanced tremendously, the ability of an artist to consider individual elements in the terrain rather than a computer’s approach of applying a technique systematically provides a unique and pleasing result.

The text sits comfortably in the map and the use of a border in a complementary colour completes the overall image. A beautiful, rich and warm map.

 

MapCarte 258/365: Drugged Culture by Stanford Kay, 2010

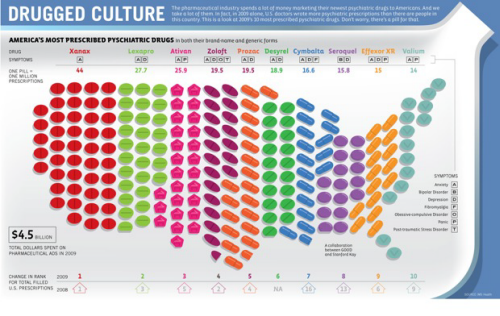
MapCarte258_druggedThematic maps can often be somewhat bland if the overall layout isn’t considered. Simply getting the construction of a choropleth or proportional symbol map right only goes half way to creating a successful map that draws people in. Combining the theme of the map with symbology that illustrates and connects to the message can lift the map above the mundane. Of course, the context within which the map sits also plays an important part. In a simple, formal report, mapping the most prescribed psychiatric drugs in the USA might need to be plain. As an accompaniment to a magazine article, a newspaper piece or a poster there’s increased license to be more graphically daring.

This map by Stanford Kay makes great use of the shape of the country as a literal container (tray) for different coloured pills. Each different type of pill acts as a series of small multiples and, overall, a cumulative histogram. It creates a cartogram of sorts and provides an attractive illustrative approach to the map which invites people to investigate the detail. The legend is organised to relate to the different drugs and there’s a good amount of information around the map to provide key facts. The title also leans towards something catchy to lure people in and provide a graphical hook.

Overall, simple, colourful and a nice marriage of thematic map and graphic design.


MapCarte 257/365: Escape the map by Mercedes Benz, 2011

Escape the map was an online advertisement for Mercedes-Benz.  It offers an immersive, interactive experience for the viewer who becomes a participant in the map-based story.  The work has drama, doesn’t overtly force the brand and follows a ‘choose your own adventure’ type plot.  It’s sophisticated, memorable and unique.

The map and map related objects like the falling map pins and address (locator) are key metaphors in the story.  The advert immerses you in the future, how we may use maps in cars and how important location is and will become not just for navigation but as a defining way of living.  The heads up display on the electronic paper map works particularly well.

The work clearly illustrates how popular maps have become in the mass media and there are numerous references to familiar online web map services, virtual globes and their techniques (such as facial blurring on Google Street View) as well as having a sub-plot that references social media such as Twitter.  This familiarity with ubiquitous mapping and social media tools means the advertisement hooks us into a familiar world to tell its futuristic story.

MapCarte 256/365: Babylonian World Map by anon, c. 750-500 BC

MapCarte256_babylonian


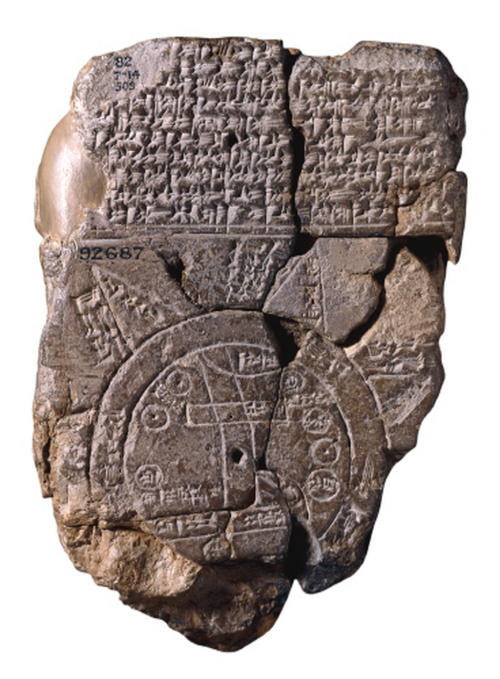
The first known map of the world inscribed on a clay tablet and depicting the known world from the perspective of Babylonia. It’s a design classic because it’s the first. Someone had the idea to represent the world around them using marks on a physical object to create a map and as far as inventions goes this has to rank among the most important to humankind.

The map is circular with cuneiform labels. The two circles represent the boundary of a water body, Babylonia is toward the centre and there is an area of marshland labelled to the south. Cities, water bodies, a mountain range and numerous islands are also shown though there is debate over whether these represent real places or mythological entities.

Possibly not quite as detailed or portable as we might prefer our modern maps but for its time this is a remarkable cartographic achievement.


MapCarte 255/365: Lifecycle by Thomas Yang (100 Copies), 2014

MapCarte255_lifecycle3

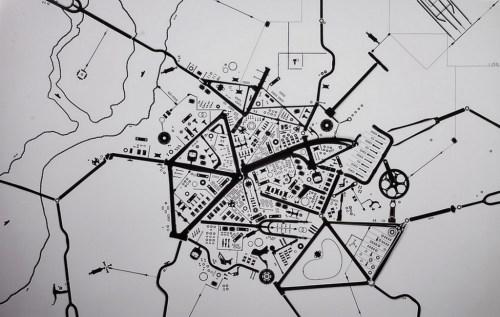
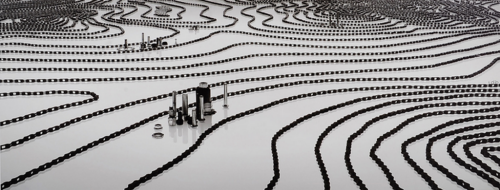
Maps are widely used as a basis for purely artistic endeavor. In this example, Thomas Yang has created a series of maps that are made out of bicycle components and then photographed. The components selected are used to denote the sort of features you’d see on a map – roads, buildings and physical features. His ability to make the map appear entirely plausible is down to the careful selection of the components that mimic different line weights and shapes, none of which would look out of place on a real map.

MapCarte255_lifecycle2

The planimetric map actually looks like a real map from a distance and you only see the components close up. The panoramic view makes excellent use of chain to represent contours, with cities rising above the landscape. Finally, the aspect of a cityscape is perhaps the least map-like but a beautiful image nevertheless.

MapCarte255_lifecycle1

A simple idea, well executed and which borrows heavily from the artistry of maps to provide a basis for a new art form. More details on the 100 Copies web site here.

MapCarte 254/365: Where Were You on Sept. 11, 2001? By New York Times, 2011

MapCarte254_911

 Click above to view interactive map

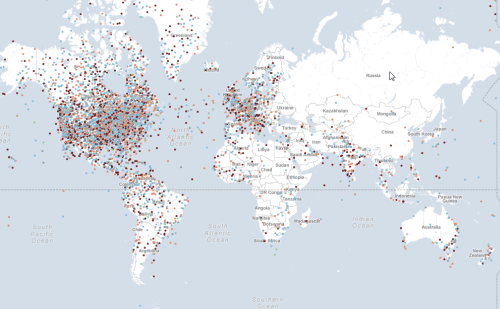
It’s often the case that a map with lots of push-pins is considered pretty poor cartography. Most would recommend that the data ascribed to each point be summed, aggregated or reported differently. Sometimes, though, the point of the push-pins goes beyond cartographic purism. This map paints an emotional picture of the response to the terrorist attacks of September 11th 2001 and was published on the 10th anniversary as a way of reflecting on the events of the day. Contributors were encouraged to leave a message and to tag their pin with an emotion such as ‘angry’, ‘fearful’, ‘unmoved’, ‘secure’ or ‘hopeful’. Any attempt to look at the responses analytically and come up with a different cartographic representation would detract from the raw emotion.

The very point of this map is to lay bare the data. It’s points on a map that reflect individual reactions to the horror of the attacks. Each person’s contribution is no more or less than any other and so providing a place for the comments to live is the purpose and it needs no more cartographic finessing. This, then, might almost be considered a spatial book of condolence.

There have been hundreds of maps that paint a picture of the attacks showing the detail of the site, the plan of the attack, the social network of the terrorists and the reconstruction but none that simply uses a map to give people a place to share their words. Maps can be divisive and the harsh lines we place on them to demarcate territory often cause conflict. This shows us that they can also be a place for humanity and that brings people together irrespective of boundaries.

MapCarte 253/365: L’arsenal de l’apocalypse by Le Nouvel Observateur, 1991

MapCarte253_gulfwar


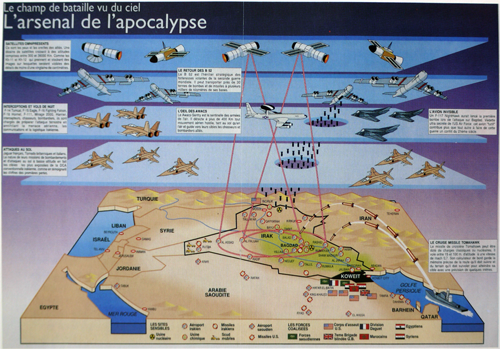
There’s nothing like conflict to get the cartographic juices of newspaper, magazine and television media flowing. It almost seems to ignite a battle to present the most compelling map or information graphic; one that brings together as much useful information in one dramatic illustration. The art in this is to ensure that clarity remains and to avoid the temptation to over-dramatise or place too much on the map. This is a challenge for cartography generally, but for a map that accompanies a newspaper article which is there as a supporting component to the story, the requirement to be prudent is paramount. The map needs to attract the reader to spend a few moments. It is a complement to the report. It doesn’t need to tell the whole story but it needs to contain the essential facts.

This French example from early in the first Gulf War shows how the balance can be achieved. there’s a tremendous amount of detail yet it’s illustrated in a clear, unimpeded fashion. The tilted block diagram is almost apologetic as the shape of Iraq is laid out amongst simple shapes of water bodies and mountains. But it’s the firepower from above that the article is emphasising as layers of armoury, missiles and satellite technology pour over the landscape. Scale is irrelevant. This is about showing the blanket capabilities of the allies. The illustration of bombs dropping through a clean-cut hole in the sky and those fired from the warship in the gulf itself are clinical. The laser-red of the satellite monitoring gives us a sense of precision. Of course, war is anything but clinical, clean and precise but these sort of illustrations present us with a sanitised version that explains the technology being used.

The maps used in such graphics are merely the canvas upon which a story is told but they are the crucial element. Combined with high quality illustrations, media maps do a good job of putting maps in front of many thousands of people.

MapCarte 252/365: Advert by Holiday Inn, 1985

MapCarte252_holidayinn


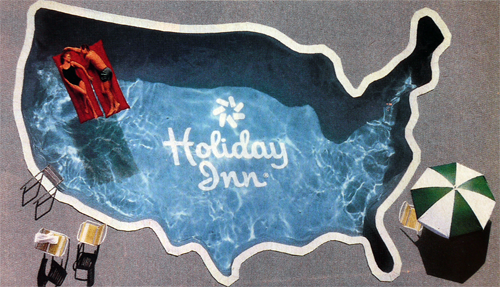
Maps are routinely used in advertising and they are normally used for one specific reason – to give the impression of just how far the phenomena being advertised has spread. We see numerous examples of maps that show us the spread of Starbucks or Walmart for instance and the map is really just a placeholder for the containment of thousands of points that we’re supposed to interpret as ‘they’re everywhere’. That may be true but sometimes advertisers use maps in far more inventive ways.

This 1985 advert for Holiday Inn gives us the same impression of national coverage. The use of the map of the United States and the imprint of the logo on the pool’s lining gives us the clear message that you can find a Holiday Inn in all corners of the country. But the advert goes further. The pool is sun-lit and inviting. It’s clean and welcoming with the parasols and chairs. The relaxing, carefree couple give us a sense of how we might expect our stay to be.

Of course, all of these messages vary between the blatant and the subliminal but they combine to give us a great graphic that does the job of advertising the brand. Maps can be extremely powerful tools in advertising but that also reminds us of the power they have in more mainstream cartographic use. People believe what they see. Maps are extremely good graphic devices to support a whole range of different messaging.

That said – I’ve never been to a Holiday Inn and seen one of these pools. Wouldn’t it be nice if they actually did exist!

MapCarte 251/365: Lunar Landings Map by NASA, 1969

MapCarte251_lunar


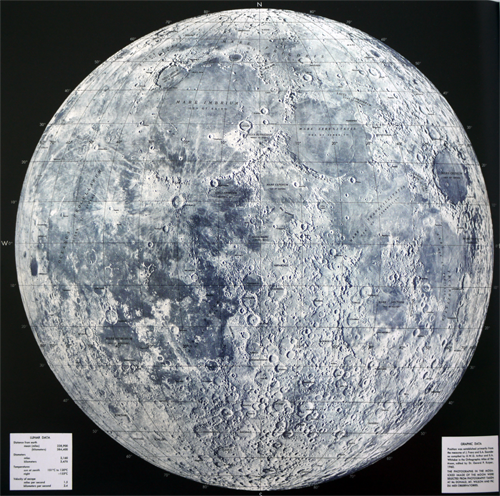
Our fascination with the Moon can be traced back to Galileo who, in the early 17th Century, started making maps of the surface using telescopes. In the mid-1650s, many others including the astronomer Giovnni Battista Riccioli also made maps and named many of the features, the names of which survive to today.

The use of unmanned space craft by NASA in the 1960s enabled far more detailed maps to be made. It’s Lunar Earthside Mosaic was a composite map created form many individual photographs. This version, at a scale of 1:2,500,000 used an orthographic projection and was used to plot Moon landings. Quite simply, it’s a beautifully detailed composite aerial photograph of the surface of the moon. The addition of labels that we’ve ascribed to the features gives it the appearance of being a little more inhabited than it is. It certainly helps us to characterise and converse about it in a way we couldn’t otherwise do.

Set against an inky black background, the simple blues and greys of the Moon stand out perfectly and the black typography is unobtrusive and uses thin line weights. A simple map created from a highly complex process.

MapCarte 250/365: American Golf by Sports Illustrated, 1990

MapCarte250_golf


There’s something uniquely compelling about the shapes that maps make. The outlines of countries, in particular, are one-off. They are instantly recognisable and allow artists and illustrators, as well as cartographers, a rich seam to exploit. There’s arguably no better way of representing something than combining a theme with a map shape.

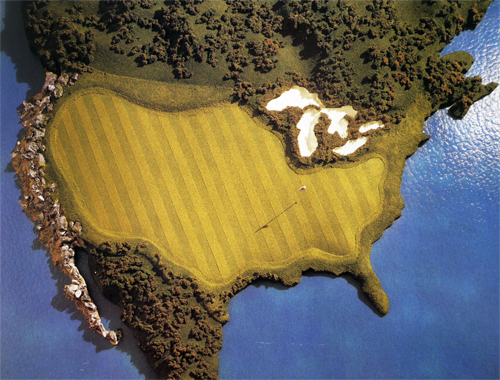
Take this fantastic example from Sports Illustrated in 1990. The illustration is a wonderful use of the shape of the United States used as a golf green. The surrounding water hazards are depicted in a rich blue, the greens are lush and the ‘rough’ in Canada and Mexico frames the green perfectly. Even the Great Lakes are turned into a series of bunkers.

The illustration was commissioned to accompany an article about the massive growth in interest in golf at the time. The use of the map emphasises the point, making us see the spread of golf as nationwide. Whether the intent was to provide a strong message or not, the illustration shows us the extent to which map shapes can be used artistically.