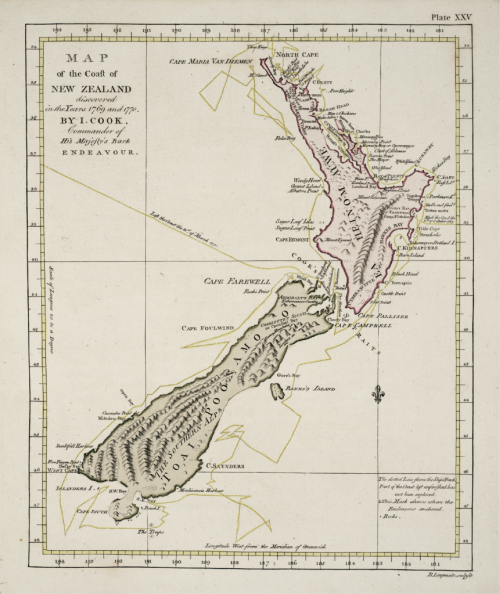
MapCarte 269/365: Map of the coast of New Zealand by James Cook, 1769

MapCarte270_cook

Imagine sailing to the southern oceans in the late 1700s without a proper clock and no accurate way of navigating and then attempting to create a map of the coastline of a country that had never been circumnavigated before. Captain James Cook was a British explorer, navigator, cartographer, and captain in the Royal Navy. After making detailed maps of Newfoundland during previous expeditions to the Pacific, Cook set out on his ship, Endeavor, to map uncharted territories.

Cook mapped New Zealand in 1769/70 in greater detail and on a scale not previously achieved. He both surveyed and named features, and recorded islands and coastlines on European maps for the first time. His mastery of surveying and cartography matched his seamanship in adverse conditions and his map of New Zealand is a masterful example of cartography given the conditions in which he was working. Indeed, It wasn’t until his second and third Pacific voyages in the 1770’s that he took one of Harrison’s clocks with him so his ability to make a map of this quality without a proper way to establish longitude was impressive.

In design terms the map is a simplified representation of the surveyed landscape. The outline of New Zealand is almost unbelievably accurate and the internal topography shows mountainscapes with molehill representations typical of the period. Labels are well positioned but its the coastline that is the main achievement of representation here. Accuracy is he success story of this map though it is a beautiful document and an important historical document.

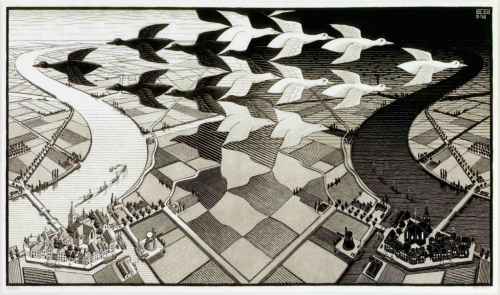
MapCarte 268/365: Day and Night by M. C. Escher, 1938

MapCarte268_escher

Our modern digital tools make manipulation of data fairly straightforward and it’s relatively simple to apply some abstract thinking and techniques in order to create something interesting. If we cast our minds back 100 years, the method of print production was based on mechanical techniques and though invented much earlier, the woodcut process saw a renaissance for fine art printing. With woodcut there wasn’t much room for error and it took a particularly skilled craftsmen to create cartographic products or, for that matter, any products. Prints made from woodcut that are based on geometrical patterns…and those with a positive and negative display are perhaps even rarer.

Dutch graphic artist M. C. Escher is well known for his mathematically inspired woodcuts and lithographs. They often feature architecture or explorations of infinity and tesselations. Here, we show his Day and Night produced when he was age 40. It’s a woodcut in black and grey printed from two blocks and measuring some 68cm wide. It was one of his first prints to show the tesselated tile approach that incorporated an abstract positive and negative image. It lends itself perfectly to the display of a map image that represents the illuminated landscape in day and night in mirrored fashion. The white flock of birds flying above the ground merge with the daylight sky on the left and to the right, the black flock blends to create the night sky. The illusion also works top to bottom as the patchwork of agricultural fields morphs into the birds in the sky.

It’s a wonderful illustration not only of technique but also mastery of design and thought. The care required to get the illusion correct is of the very highest order. In some senses it also illustrates how one might have gone about creating thematic maps where different shades of monochrome were required (e.g. in a choropleth) since the patterns and differences between shades are perfectly balanced and easily distinguishable which is in part why his work is so well formed.

You can see much more of Escher’s work at the official site here. Well worth a look!

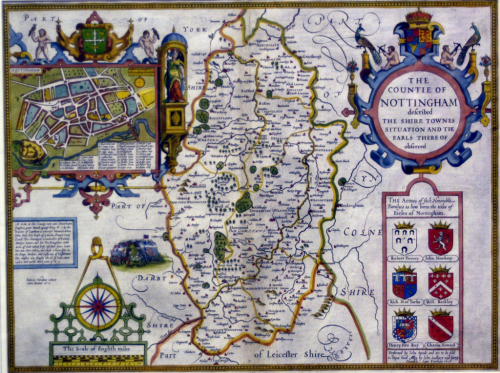
MapCarte 267/365: Theatre of the Empire of Great Britaine by John Speed, 1611/12

MapCarte267_speed1

Many historical maps become objects of desire simply due to their antiquity. Rare and collectible maps are, however, not necessarily beautiful in design or aesthetic terms. The maps produced by John Speed in the early 1600s for his Theatre of the Empire of Great Britaine are exceptions and are both highly collectible and remarkable objects.

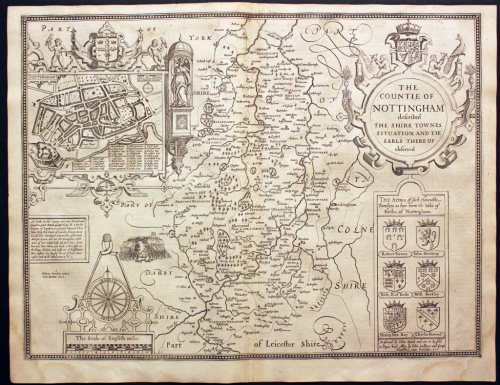
The atlas was the first to collate detailed maps of English counties, printed from copper plates which had been engraved in reverse by Jodocus Hondius in Amsterdam. Each atlas was either offered uncoloured or coloured by hand and though only a few colours were used it is this colouring that gives them such a pleasing appearance. The borders and main elemants of the maps framework such as the cartouche, coats of arms and vignettes are all coloured. the maps, actually, have a very limited amount of colour applied, used principally as a mechanism to highlight pictorial symbols (e.g. trees). The main use on the map is as a way of illustrating county and district boundaries using different adjacent coloured bands, a technique which went on to be used extensively in atlas design (for instance by National Geographic). The colours are bright and bold and add to a map already expertly detailed and engraved.

MapCarte267_speed2

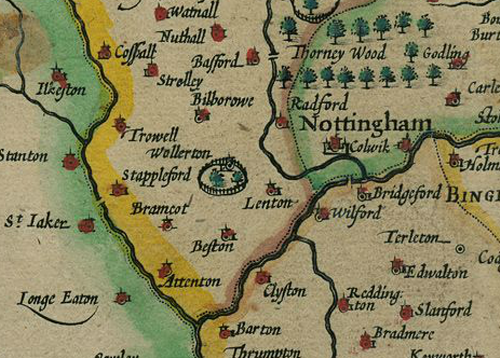
Speeds maps were at the time constructed from the most up-to-date surveys (from Saxton for instance) so as scientifically accurate as they could have been. But they weren’t just derivative. Speed added his own innovations such as detailed town plans on many of the maps, panoramic scenes of topographic, historical or archaeological importance to the county and also coats of arms of local Earls and Dukes.

MapCarte267_speed_detail

These small yet highly decorative and attractive maps are collectible now, but were also a classic of information of the time.

A complete set of maps can be viewed online via Cambridge University Library here.

MapCarte 266/365: Wonder map of Melbourne by John Power Studios, 1934

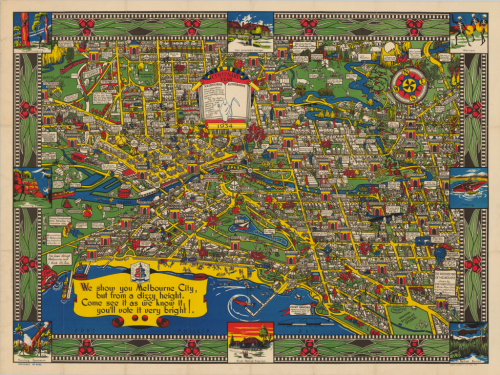
MapCarte266_melbourneIn 1914 Macdonald Gill drew his Wonderground map of London (featured in MapCarte 15). It brought a cartoonesque aesthetic to the streets of London and included pictorial elements and other delightful characters that produced a playful, whimsical but detailed and well marshalled map. Twenty years later, this map appears. It’s a map of Melbourne, Australia which displays a remarkable resemblance to Gill’s original. Considering we’ve already discussed Gill’s map, why is it necessary to include a derivative?

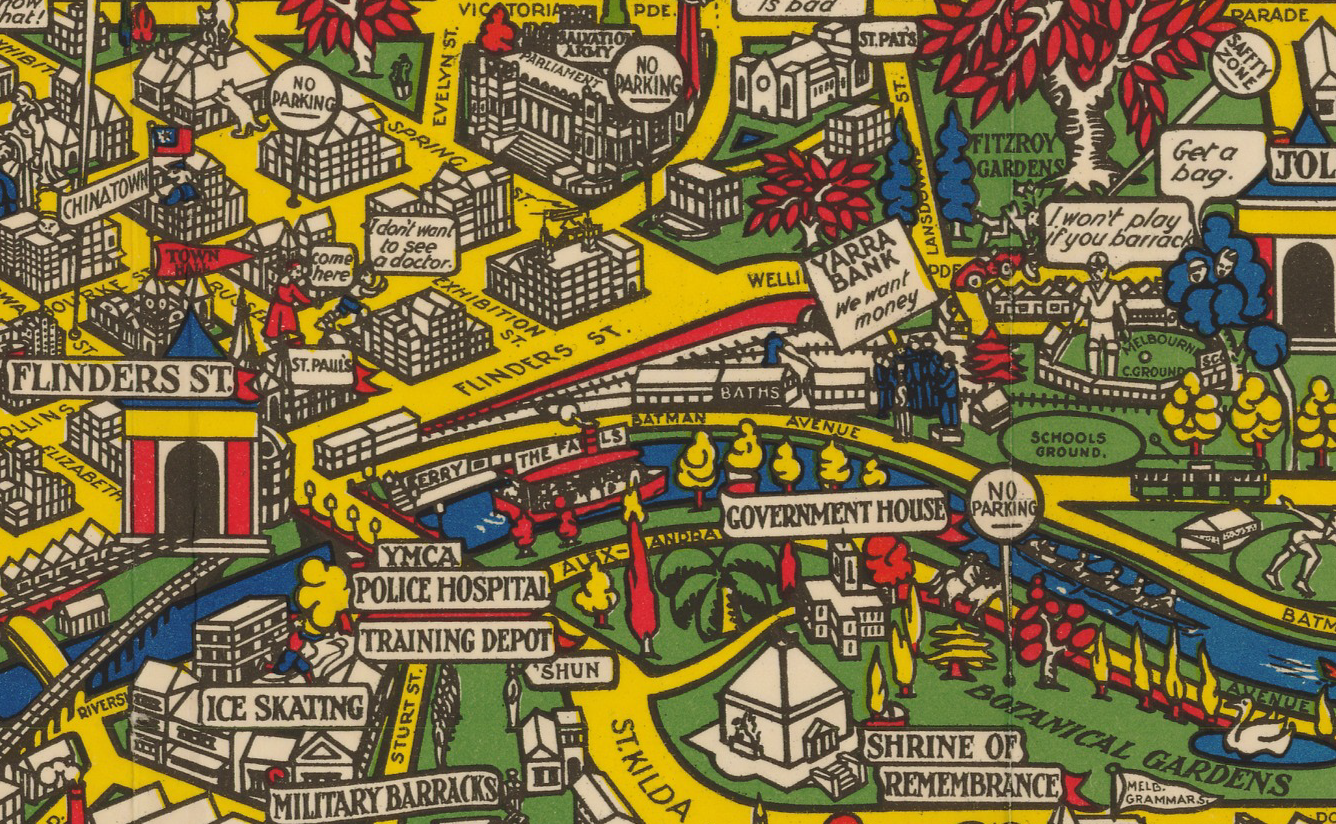
In design terms, there’s very little that is genuinely new in cartography. Most of what we seen owes something to what has gone before either in terms of some small element or, perhaps, in its overall style. Taken to extreme, derivative works can become merely pastiches (see the perpetual use of Beck’s subway map as a basis for alternative cartographies for instance) but sometimes they reflect an homage to a particular approach.  There’s a fine balance between homage, pastiche and plagiarism but here, the authors have shown a keen eye for their own landscape and geography and created a map in the style of Gill’s but with a clear Australian dimension.

MapCarte266_melbourne_detail

In this sense it’s worth promoting the idea that design doe not necessarily need to be wholly original to work. Many great cartographic effects and styles get re-used and re-imagined. New places and new ideas can add to the canon but in the main, maps tend to show subtle or blatant lineage.

MapCarte 265/365: O Mapa do Tráfico by Eduardo Asta, 2014

MapCarte265_asta

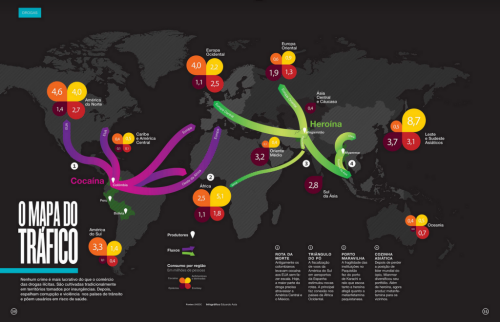
Occasionally, a map can be tangential to the graphic display…sometimes even a luxury or superfluous in it’s fundamental sense. This scenario tends to happen with very simple data and where a thematic map with no topographic detail is about as detailed as one would need. This example of the global drug trade illustrates this perfectly. The flow lines between regions of origin and consumption are perfectly represented by the lines. The proportional symbology illustrates the mix of drug types. There is little need for the map and it is simply used here for emphasis.

Detail is minimal; and the information could easily have been presented in a series of graphs, yet by using the map Asta has immediately connected people’s view of the trade to places. It is used to good effect since the outline of the world is barely visible and recedes to the background. The vivid colours are visually powerful and the text is there for those wishing to read further, though it’s unnecessary in order to get the idea of the information being presented.

A simple dataset, mapped simply but with good clear design to support ease of use, information recovery and understanding. The map is tangential yet plays a good supporting role.

MapCarte 264/365: Plan oblique relief Europe by Jonas Buddeberg, Bernhard Jenny & Johannes Liem, 2014

MapCarte264_planoblique


Click the image to view the web map

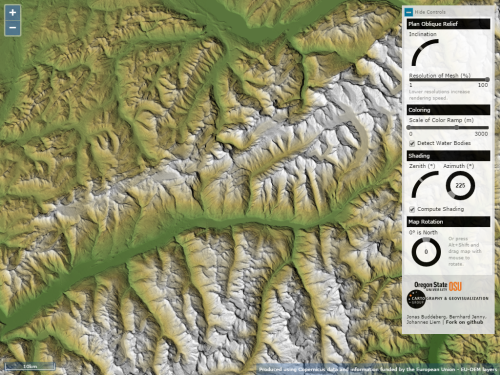
Representation of terrain is as old as cartography itself and there remain numerous ways of creating interesting effects. Plan oblique can be traced back to the work of Xaver Imfeld in 1887 (featured in MapCarte 182). It’s an interesting technique because it uses a planimetric base (thus preserving scale in all directions across the entire map) yet represents terrain in apparent 3D. The trick is that the terrain is effectively stretched in the north/south axis such that the base of the terrain remains static and the peaks move…stretching everything in between. The technique overcomes some of the limitations we inevitably get with panoramic maps where foreshortening and occlusions are potentially problematic.

There are plenty of ways one can create a plan oblique effect using Digital Elevation Models (unless you have a preference for the hand-drawn approach like Imfeld) but the beauty of the map application developed by Buddeberg et al. is it gives the user all the tools to modify the variables that control the appearance on the fly. Azimith and inclination are basic variables to allow the creation of hillshades and 3D relief. Additionally, users can modify hyposmetric tints, the rotation and, crucially, the inclination of the viewing angle that modifies the plan oblique effect. The user controls are intuitive; the effect impressive; and the way in which the application reveals the nuance and beauty of a plan oblique representation unparalleled.

MapCarte 263/365: Map on a cow by anon. date unknown

MapCarte261_cow


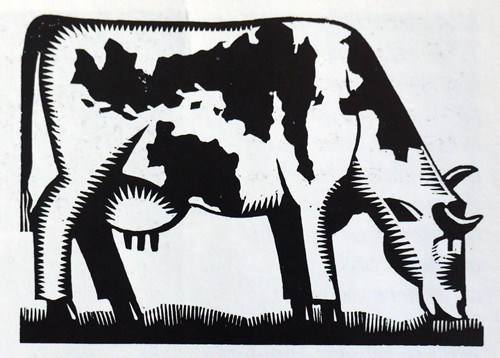
Integrating maps and map shapes into other designs has been a popular approach in graphic design for decades. This isn’t pure cartography but it’s the use of cartographic design and products to emphasise another design or to create a juxtoposition. This woodcut, possibly from as early as the 1500s though more likely a nineteenth century example due to the angled lines, illustrates a Holstein Fresian with it’s distinctive black and white hide in the design of the British Isles. The northern coastline of France is also included for cartographic completeness!

The beauty of such images is that at first glance they appear perfectly ordinary. The markings have to be ‘seen’ but when they are, they become impossible not to see. Maps are incredibly flexible and their use extends far beyond their cartographic purpose. They are fantastic when used in other art and graphic design projects. They do not have to be complex either…as this wonderful whimsical example shows.

MapCarte 262/365: Map of Venice by Jacopo de’ Barbari, 1500

MapCarte242_barbari

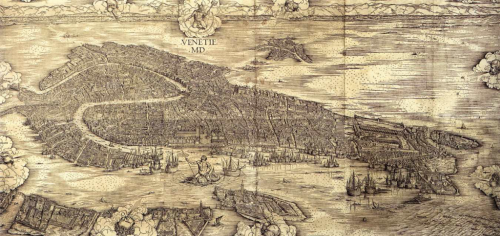
The very first aerial photograph was taken by French photographer and balloonist Gaspard-Félix Tournacho, in 1858 over Paris. That fact alone makes this map, produced some 350 years earlier even more of a monumental cartographic achievement than its beauty alone suggests. Produced from wood-block printing on several large sheets, this birds-eye map shows the city of Venice with the Alps acting as a distant horizon.

The detail is exquisite with almost no stone unturned – literally. Every building, church and piazza is shown and such is the attention to detail that one could easily use the map then and now to navigate around the city.

Barbari’s skills as a painter and engraver show how mastery of one’s tools is fundamental to great cartography. What the map perhaps fails to convey is the way in which it was constructed. Given Venice is built on water traditional techniques of measurement (physical rods or chains) wouldn’t have been used to gain measurements. Instead, Barbari must have used trigonometry and then applied foreshortening to generate his oblique perspective. These are techniques not adopted for many years to come.

Whatever you use to design and make a map, knowing how to apply the tools to a high standard goes a long way to ensuring the result will be high quality. Painting, engraving and mathematics underpinned Barbari’s work. It resulted in a magnificent map.

MapCarte 261/365: Skintland by The Economist, 2012

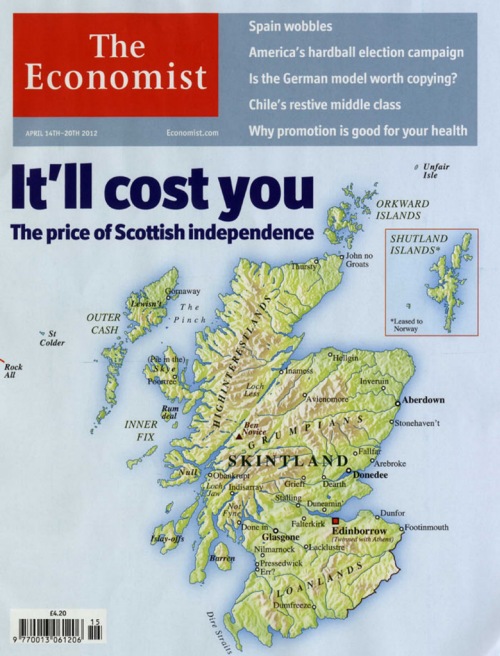
MapCarte261_skintlandWe’ve featured a number of fantastic satirical maps in MapCarte as artists, illustrators and commentators make good use of maps to convey a pithy message. Robert Dighton’s Geography Bewitched makes good use of Scotland as a map shape which was featured in MapCarte 43. It was inevitable that today’s referendum on Scottish independence was also going to lead to some examples and The Economist’s 2012 effort shines brightly.

Not without controversy, the map of Skintland shows the familiar shape and topography that hides the labels if you don’t look closely enough. Each city, town and physiographic label takes on a new meaning as a way of expressing the editorial comment of the potential result of Scotland’s economic plight if they vote for independence from the United Kingdom. Glasgow, Edinburgh and the highlands have been replaced by Glasgone, Edinborrow and Highinterestlands. The Shutland Islands have been leased to Norway and the Outer Hebrides are now know as the Outer Cash. In the 18th Century, Edinburgh was referred to as the Athens of the North because of its fine architecture and its Enlightenment role. Now it’s labelled as Twinned with Athens to parody the economic failures in Greece. It’s a well observed addition.

Skintland is shown as an island and the coastal vignette carries on across the land border between England and Scotland to reinforce the message of being economically cast adrift. The map works because it’s well designed, not over-done and the joke is easily understood. The fact the map appears in The Economist makes it sit well and lends a certain gravitas to the ideas it represents rather than the impact it might have had in a tabloid publication.

Of course, the map has received scorn from the proponents of the Yes vote and many others who saw it as a slight on Scotland and it’s people as you’d expect…but that’s the point of satire. Someone will always be offended! What the map, and subsequent reaction, shows is the strength of feeling that places have in our hearts. Names on maps become valubale and if we change them, albeit with the intention of humour, those with a vested interest can easily be hurt. As a way of generating sales the map does wonders. It also shows us that maps are sacred objects and one has to tread carefully with design to avoid such ire…or do it deliberately well precisely to provoke a response!


MapCarte 260/365: Baseball Stadiums ArtMap by World Impressions, 1987

MapCarte260_artmap1

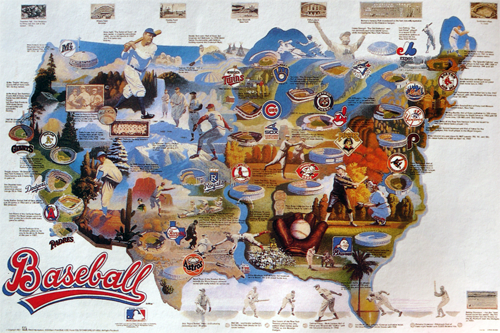
Pictorial maps are often some of the most artistic, combining illustrations of a theme to create a dramatic, attractive poster. They are commonly used to build a picture of a phenomena that perhaps draws people in who have some vested interest in the content…sport being a favourite theme for such maps because of the passion and association people bring to the map.

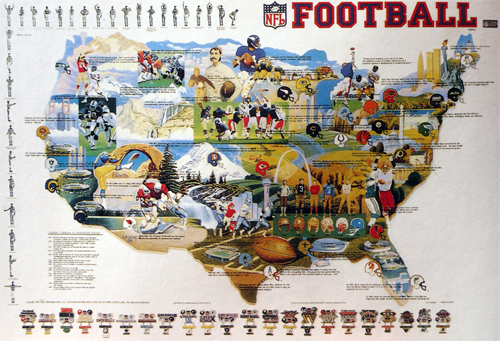
Here are two examples of maps by World Impressions that showcase the very best of the collage approach that incorporates key imagery from all teams. the first illustrates baseball and the second, American Football. The illustrations vary considerably from paintings of the natural landscape to key historic sportsmen to stadiums and team logos. The lack of uniformity creates interest and the poster allows a viewer of the map to immediately identify their own team as well as their opponents across a map that gives them an equal visual treatment.

MapCarte260_artmap2Textual components are minimal but the borders are well framed using allied imagery. Here we have a map that is designed simply to stimulate our passion for the sport and the teams we support. It shows where the teams are based but the spatial component is secondary to the emotional response the map is intended to invoke.

Done well, as these two maps are, pictorial maps can be attractive as pieces of art. They often adorn our walls and act as a reminder of our team and their place.