Click image above to go to project web site
On the face of it, mapping patterns of people spending money over the Easter period doesn’t sound particularly fascinating but the content is not the focus here. MIT’s Senseable City Lab, with BBVA, use an unprecedented dataset of financial transactions on which to craft their innovative cartography.
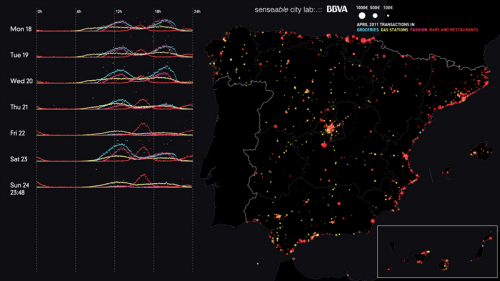
The work illustrates the purchasing patterns across Spain during Easter 2011. Using data gathered by the BBVA banking network of over 4 million transactions, this visualization shows how 1.4 million individuals and 374,220 businesses spent €232 Million in the week of Easter.
The map examines the spatio-temporal character of transactions categorized by the type of sale (e.g. food, fashion, restaurants) but instead of just delivering flashing lights as so many animated temporal maps do, the sensible speed and classification of the work allows the person viewing to assimilate the information.
The data is graphed and is shown at the same rate as the map giving a view of the peaks in graph form as well as spatial form. The clear vertical time lines anchor the graphs and, cleverly, the use of blacks to browns gives us a way of seeing night and day. The labels of the classes use the same colour as the data points themselves which is a simple but extremely effective way of reducing the barriers to seeing.
An extremely well constructed web map that proves it is possible to take a huge dataset and make a spatio-temporal map that makes sense.


