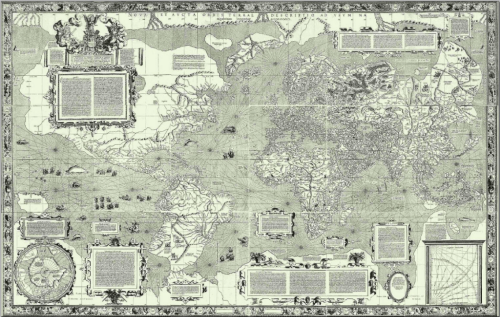
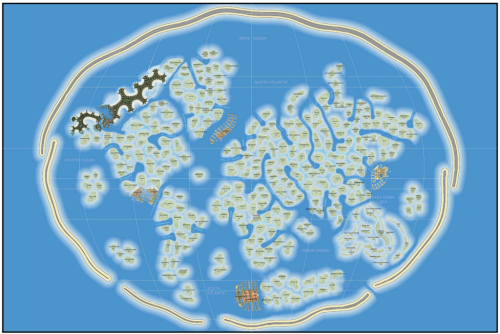
 In possibly the greatest example of cartographic simulacrum, the World Islands project is both befuddling and impressive at the same time. The idea to create a completely artificial archipelago of small islands in the shape of a world map might seem extravagant but then why not? In the search for cartographic curiosities it’s relatively easy to find maps that hold certain titles (oldest, largest etc) but constructing something on an altogether grander scale was always going to take a special place. That place, of course, is Dubai and a project originally conceived by Sheikh Mohammed bin Rashid Al Maktoum, the ruler of Dubai.
In design terms it’s the scale and imagination of the project that impresses. The project to create some 300 or more islands by dredging sand began in 2003. It has yet to be completed though most of the islands have been sold to private contractors ahead of development. Only two of the islands have been developed thus far but the world’s richest people and organisations always need frivolous reasons to spend money and what better than a ‘country’ all of their own in World Islands.
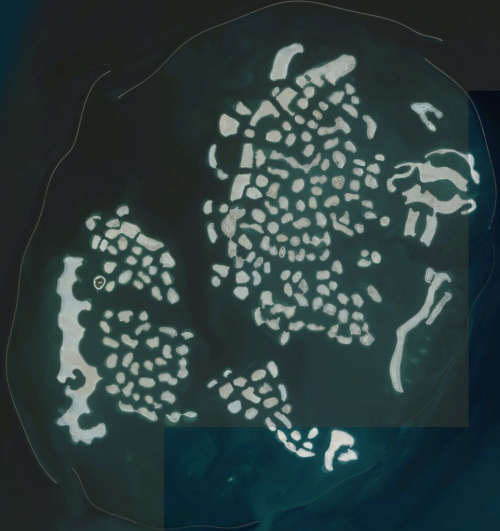 The archipalago measures some 9km by 6km and the islands range from 14,000 to 42,000 sq metres. Distances between the islands averages 100m and the shorelines total approximately 232km in length. Dredging for the islands was completed in 2008 and in early 2012 the ‘Lebanon’ island opened as a commercial island for private corporate events and public parties with the Royal Island Beach Club. The project is really quite astonishing and shows how vital the shape of the countries on our planet really are for all manner of artistic projects. They inspire so much beyond making maps.
What could be better than partying on a map of the world on the world?

