
Ordnance Survey has long held a reputation for unsurpassed quality and coverage in its mapping. It’s been steadfast in its approach to mapping of Great Britain such that the quality is world renowned and the envy of many countries. In 2001, Ordnance Survey launched a brand new product to bring its large scale products into the 21st century.

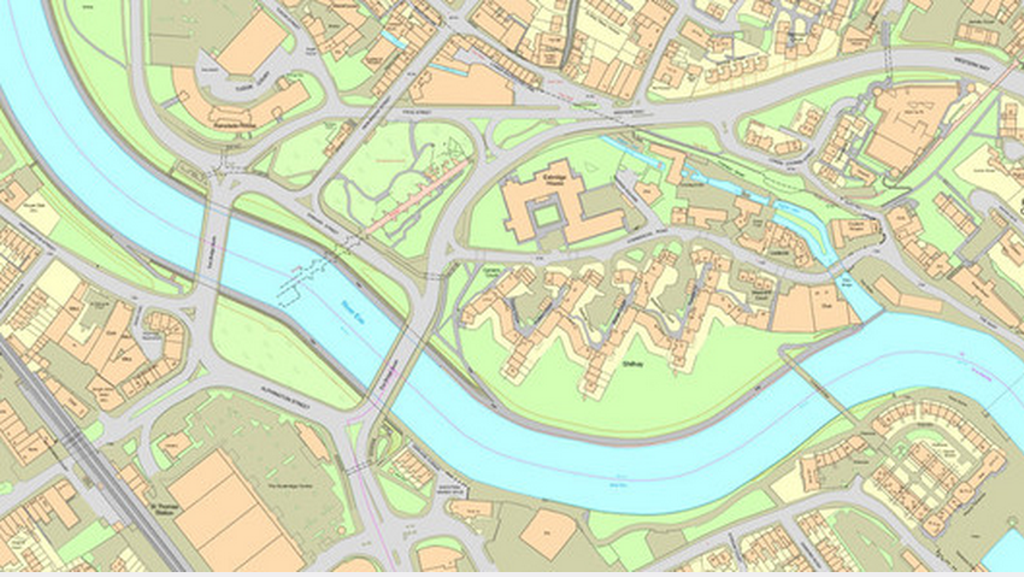
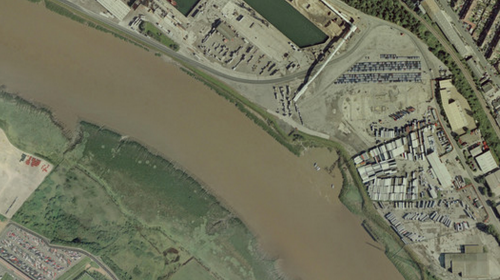
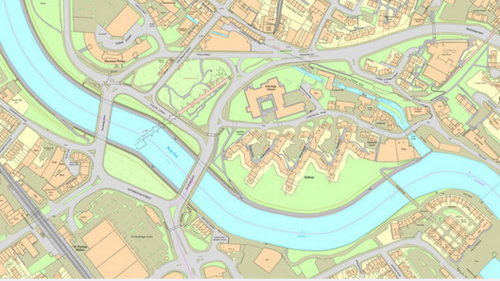
Not so much a map as a digital product that records every single fixed feature of Great Britain in a contiguous database, MasterMap® represents the most detailed, consistent and up-to-date geographical vector database of any country at a scale of 1:1250. Four separate layers contain topographic, transport, address and imagery data to form the full product. Later, additional layers for water and sites were added.
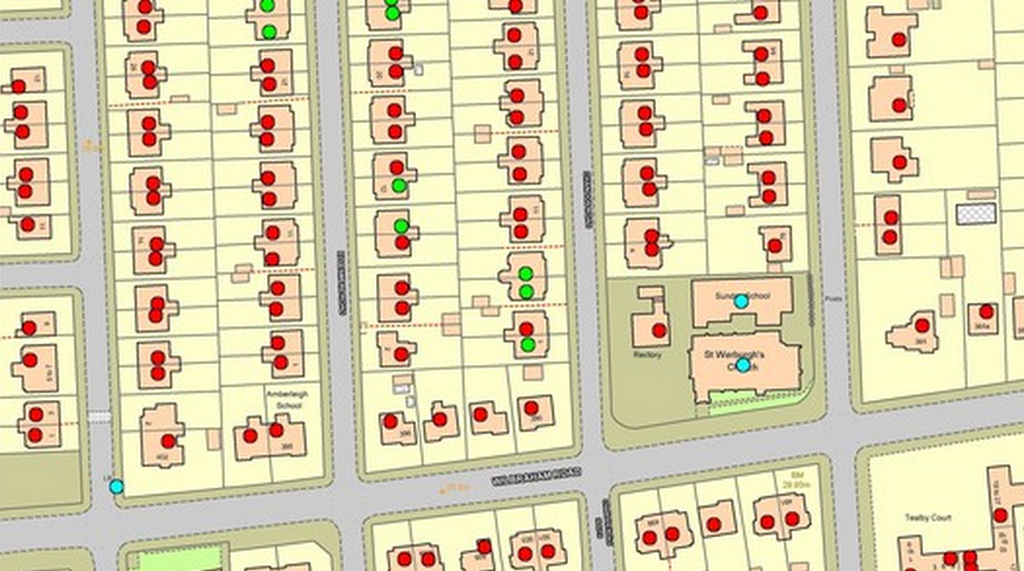

Every feature is assigned a Topographical Identifier (TOID) that gives it a unique reference as well as attribute information to classify it and support mapping tasks. Continuous review means the database is as current as the latest ground survey data captured in the field and the product is versatile and flexible enough to suit a myriad of mapping purposes at different scales.
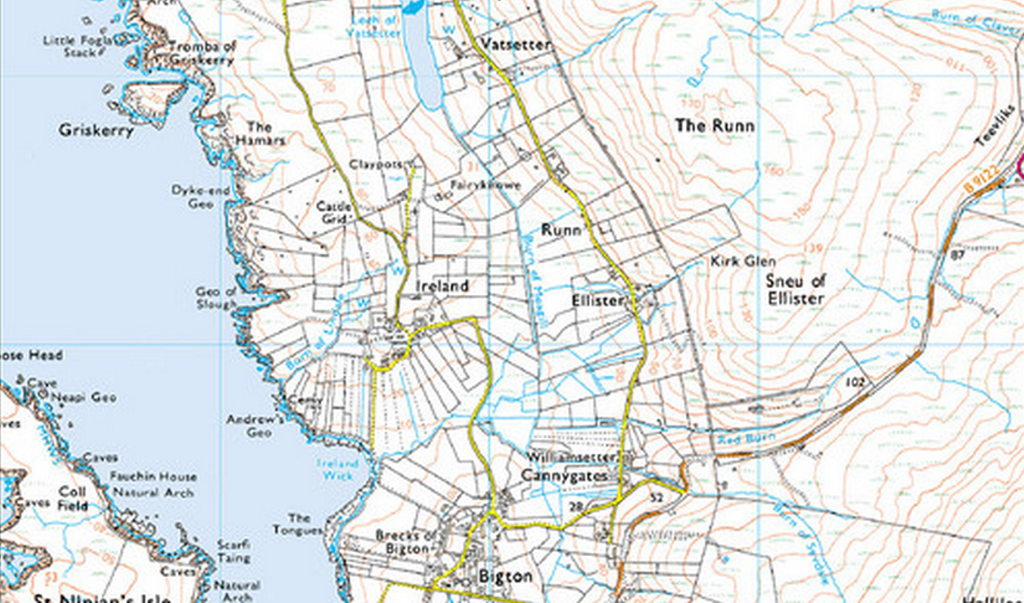
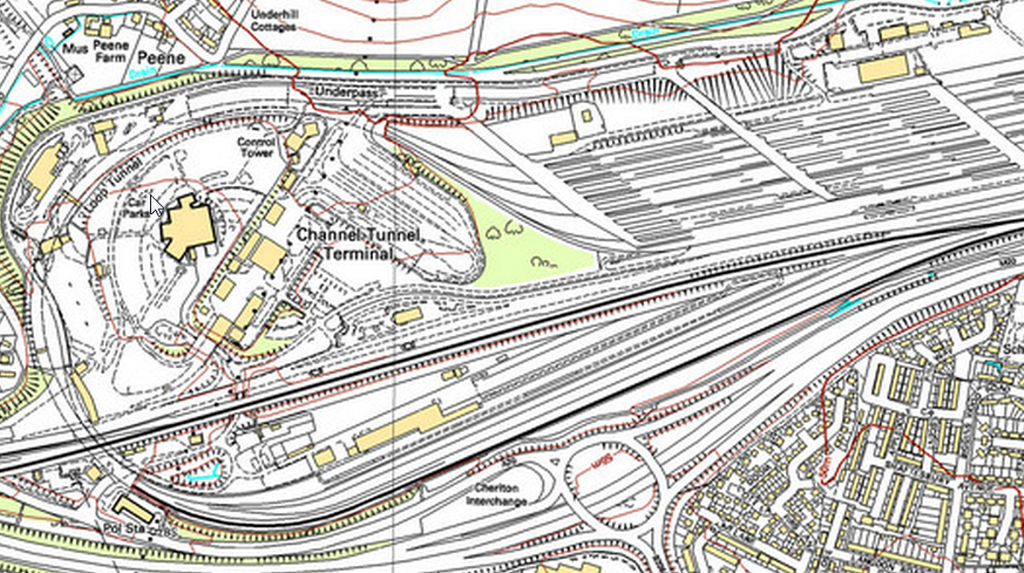
The schema is robust and currently the database contains over 460 million individual features with extensive metadata. As a product, the release of MasterMap® was, and remains, innovative and its scale and level of detail are unsurpassed. The uniqueness of its design is in the construction of a database that supports the mapping needs of a diverse set of user requirements. Key to the utility of the product is the ability to select and style the elements from the database that are required for a specific need. Thus, the product can be styled to give it the classic Ordnance Survey appearance, or to match a user-specified style and product requirement.
More details of Mastermap can be found on the Ordnance Survey web site here.