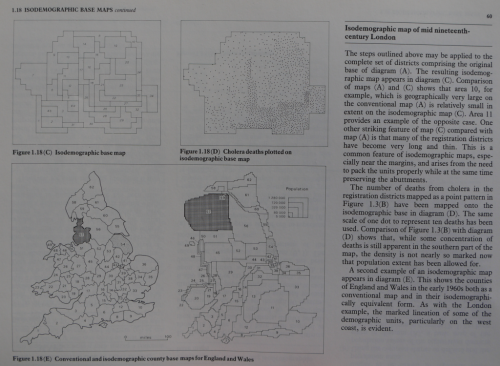
MapCarte 242/365: Geomorphic/Geologic map of part of the northern hemisphere of Venus by USGS, 1989

MapCarte242_venus

Given some of the difficulties we seem to have in mapping our own planet, it’s a surprise that we are even able to make maps of other planets in the Solar System. But planetary cartography is a vibrant and thriving activity for many scientists and map-makers. The maps derived from telescopic survey or from radar, ground rovers, deep space craft and satellites gives the planetary cartographer data from which to make their maps. Such maps are normally of the topography or geology.

Venus is the closest planet to Earth but it’s still 162 million miles away. Put another way it’s about the same distance as 50,000 journeys from London to New York.. It’s amazing we can even make a map but not only that, they are beautiful.

Because the maps are predominantly dealing with geology and surface characterisitcs the maps tend to take on the style of a typically earthly geologic map yet the colours vary. they are richer, more saturated and – perhaps a little more un-earthly! Many maps of other planets are simply beautiful abstract works of art. This example is of the northern hemisphere of Venus by USGS using data predominantly from the Russian Venera 15 and 16 orbiters. Colours correspond to discrete features like volcanoes (reds/pinks) and plains (yellows/greens).

Artistic cartography but some of the most scientifically derived. Large versions of this map can be seen on the USGS web site here. Many more can be seen on the Lunar and Planetary Institute web site here.

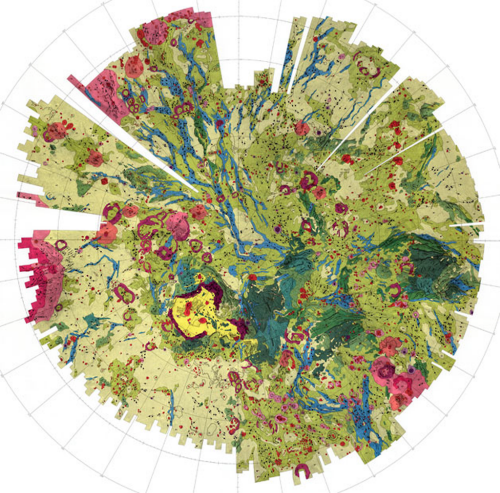
MapCarte 130/365: Atlas of Disease Distributions by Andrew Cliff and Peter Haggett, 1988

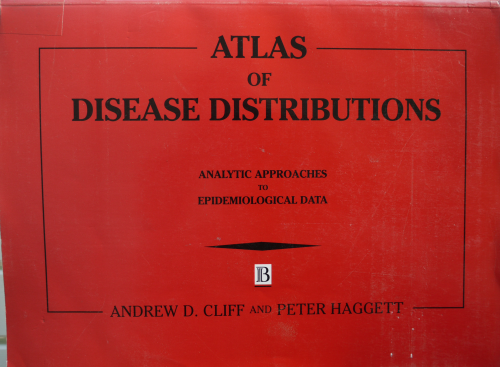
MapCarte130_disease1Sometimes a subject warrants more than a single or a few maps to flesh out the thesis. If you’re area of expertise is in the academic study of a narrowly defined interest then you are also entitled to go into considerable depth on a topic of study and also in how you bring it to the attention of a wider audience. Cliff and Haggett are renowned for their meticulously detailed works on a range of topics loosely described by the field of medical geography. They are interested in spatial epidemiology and the way in which geography plays a part in human disease distribution and transmission. They have published numerous reference works but their atlas of disease distributions: analytical approaches to epidemiological data, stands above them all.

MapCarte130_disease2

MapCarte130_disease3

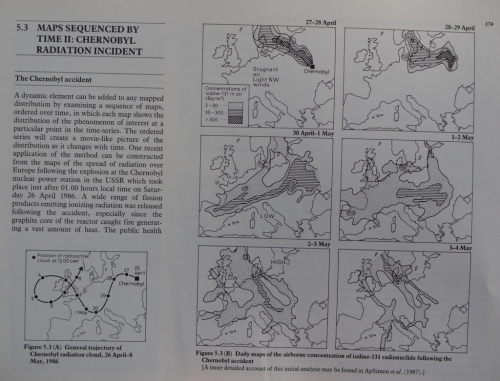
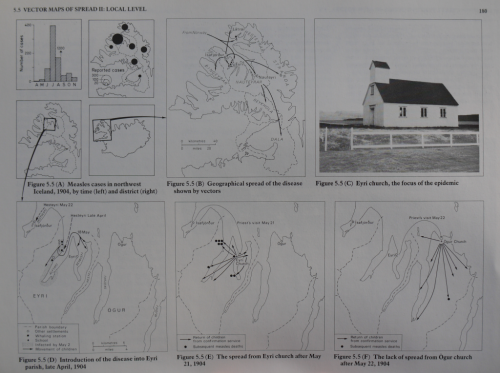
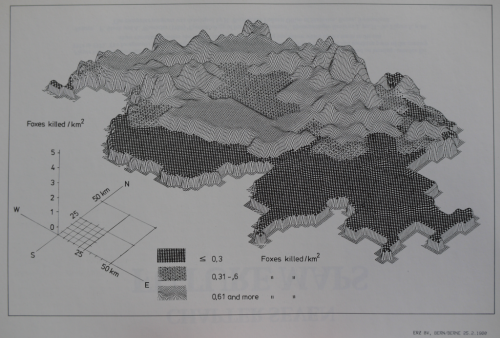
The approach in the atlas is to provide a detailed and thorough exposition of the way in which human disease affects us as individuals and populations; how it moves and spreads and how environmental circumstance, lifestyle and behaviour all play a part in creating a unique geographical dimension. This is rich, detailed work. It’s authoritative and backed up by rigorous scientific study. Each page is filled with carefully worded explanation and lavishly illustrated with copious graphs, tables and maps. Individually, each is well crafted and adds to the wide-ranging study. The work incorporated a range of other sources of information in addition to the author’s own work in studying disease in Iceland including newspaper clippings, statistical summaries and equations that have defined the state-of-the-art of statistical disease mapping.

MapCarte130_disease4

MapCarte130_disease5

This atlas represents a monumental accomplishment of academic study and presentation. It was unashamedly methodological and not only illustrated results but explained how they were arrived at using classic outbreaks of measles, influenza and cholera as examples. Very rarely do we see such detail on a single topic spread throughout such a large volume and the atlas still remains perhaps the single best book of approaches to a rigourous and mapped analysis of epidemic disease. Cliff and Hagget’s work is an illustration of clear and rational scientific thought, illustrated in an accomplished style for both the scientific and also the lay reader.