Regional boundaries defined for the purposes of administration inevitably split a country into arbitrary areas. Such areas are never optimal for every mapping situation so one way to overcome the limitation is to draw your own boundaries. This isn’t an insignificant task and requires a deep understanding of the new geography as well as the data to be able to construct the new boundaries.
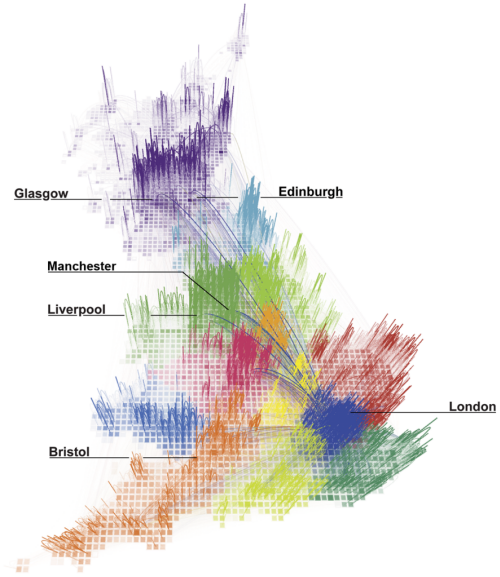
Here, Carlo Ratti and colleagues questioned whether traditional existing administrative boundaries respect the natural ways in which people interact by delineating space using an analysis of the network of over 12 billion individual telephone calls. What they achieved was a beautifully abstract map of Great Britain that shows people interact inside traditional boundaries.
The map base is a grid of squares each comprising 3,042 pixels. Each pixel is a node and its connection strength to every other pixel is shown by varying opacity. This creates a strong structural framework for the map with connecting lines showing the strongest 80% of links. Colours identify regions that emerge through analysis with the dark colour for London allowing lines connecting it with elsewhere to be clearly seen across lighter regions.
The prudent use of labels to identify major cities is just enough to support interpretation and the leader lines tie them well to the map, clearing the map itself of labeling. The tilted viewing angle allows connections to be seen in a way that a plan view wouldn’t allow and since height of the connections is unimportant the perspective distortions don’t compromise the view.
A stark map in many ways and one that hides the complex conceptual and analytical framework that underpins its construction. It works.


