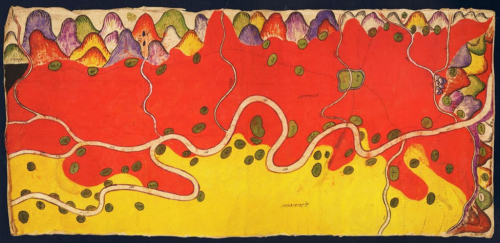
MapCarte 333/365: Disputed territories of Burma, Siam and China by Anon, 1889

MapCarte333_burmaIn the late 1800s the Burmese already had a good appreciation for topographic mapping and cartography in general. They used maps for taxation and land use and also as a way of plotting military campaigns. Many of these maps were collected by British diplomats and also colonial authorities but in addition, indigenous maps by the Shan and T’ai peoples were also collected. Here, a Shan map created in 1889 relating to a border dispute between Burma and China illustrates wonderful cartographic approach using colour to represent the different areas.

This map was painted by an anonymous Shan artist in tempera on paper and it covers an area of 47 square miles along the Nam Mao (Burmese Shweli) River. There are about eighty villages and hamlets shown in green. The map text is in Chinese Shan with red areas representing the British Shan state of Möng Mäo and yellow showing Chinese territory. The colours are rich and vibrant and leave the reader in no doubt as to land ownership.

Most of the map is planimetric but the mountainscapes on the upper and right borders show the bounding mountain ranges in aspect with wonderful colour. By modern standards there’s considerable cartographic license in terms of the precision of the topographic record. In design terms, the map is a work of art and a quite sumptuous representation.

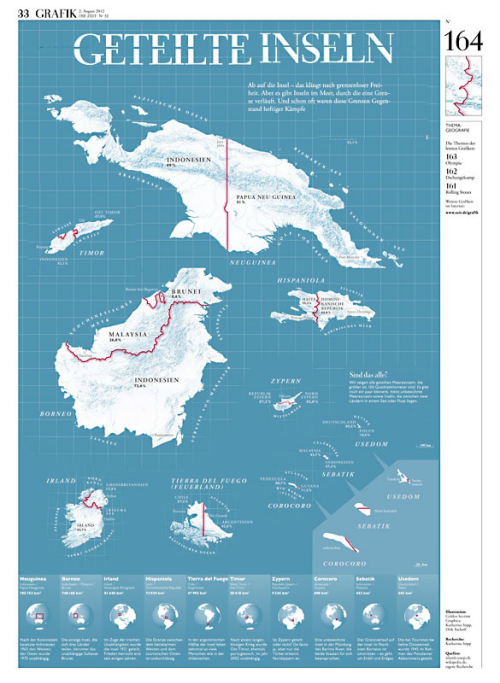
 

MapCarte 229/365: Divided Islands by Die Zielt, 2012

MapCarte229_islands

Sometimes what seems the most insignificant of map topics makes for some of the most intriguing cartography. In fact, the quality of the cartography might be one of the reasons that makes a perhaps uninteresting topic all the more interesting.

Here. Die Zielt magazine has created an illustration of the world’s divided islands. There’s no more explanation needed because the title says it all. In fact, it goes to show how important a title can be in framing the map. Of course, the geography is completely dispensed with as the islands are illustrated from the largest at the top of the page to the smallest giving a good balance. The faux-grid in the background hints at a proximity that doesn’t exist but it helps to group the islands together not just by theme.

The use of colour is exceptional by using blues for all features including the background, white for text and a strong red line to illustrate the borders themselves. The globes at the foot of the page give us a good structure and the overall composition is well crafted.

A simple idea, almost whimsical but which demonstrates the power of high quality cartographic design.


MapCarte 162/365: An American Watershed by John Grimwade, 2003

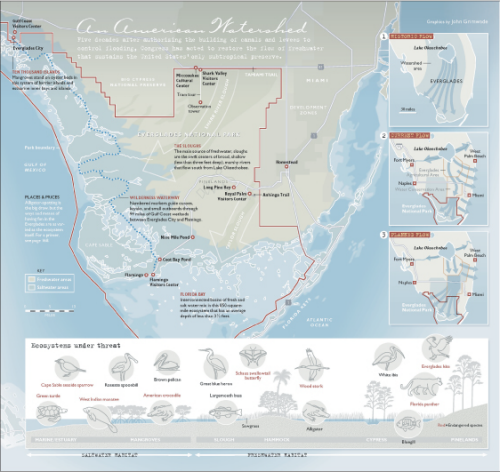
MapCarte162_grimwadeMany maps are designed for multiple purposes and, increasingly, basemaps and other core maps that sit behind thematic overlays are designed with flexibility in mind. However, they are rarely designed for the specific task in hand and that can often result in a compromise between the graphical structure, colour and typography of the basemap and whatever someone else is placing atop.

One-off maps don’t suffer these potential problems from a cartographic design perspective. The map-maker can literally begin with a blank canvas and design the whole range of information to act harmoniously. Here, John Grimwade has created a beautiful medium scale map of the Everglades in Florida CA used in a Condé Nast Traveler magazine article. His use of colour is particularly impressive because with an extremely limited pallete he’s managed to imbue the map with rich detail and character. He uses white linework to great effect and dark greys and a rusty red for accents and hierarchy. The composition works well with clear insets and a graphic at the foot of the page that explains the ecology in cross-section.

One-off maps have the scope to be more attuned to the cartographic task in hand rather than relying on the hit-and-miss of mashing up a map using third-party maps. Done well they can provide delightful single-purpose maps.

More of John Grimwade’s excellent work on his web site here.

MapCarte 39/365: Death in Grand Canyon by Kenneth Field and Damien Demaj, 2012

MapCarte39_field1

Forgive the posting of one’s own work but as it’s the author’s birthdays on 8th and 10th Feb and the map won the ‘best map at the International Cartographic Conference in Dresden, 2013 we figured if others feel it has cartographic merit it’s deserving of inclusion in MapCarte…

This map was designed in two ways for both print and web, each allowing the consideration of the opportunities and limitations of the two mediums. With print, you get the map at once and it has an immediate impact yet we have to resort to an inset for the detailed areas. With the web, multiscale allows us to increase detail as we zoom in and so we can use a hex-binning technique at smaller scales and switch to true locations for every location at larger scales. We can also switch out the basemap at larger scales online to use a satellite image that gives us a clearer impression of the actual character of the landscape. Additionally, whereas we can only include c.20 text vignettes describing the incidents on the print map, the full details of all 700+ incidents can be explored on the web map.

The map employs a chromastereoscopic technique that allows us to encode some variable using spectral colours. When viewed through chromadepth glasses (that contain small prisms) red is refracted so it appears closer to the eye and blue refracted so it appears farthest away. Other colours are refracted between these two endpoints which creates a 3D holographic effect. Elevation was encoded in this way so we see deep red plateaus descending to the blue of the Colorado. Other map elements used pure red hues to build subtle visual hierarchies for the map content. The ‘comic book’ style complements the dramatic colours and theme and pictograms are used to represent categories of incident..as ‘warning’ triangles on the print map and tesselated hexagons on the online version.

The chromasteroscopic technique is unlike other 3D techniques in that the map is perfectly legible without the 3D glasses…a little jarring visually because of the highly saturated colours but Grand Canyon provided a great landscape to map this way because of the naturally red rock.

Print map can be downloaded here.
Online version of the map is here.
Chromadepth glasses can be obtained from American Paper optics here

Thanks for the indulgence…normal service resumes tomorrow.