Forgive the fact it’s one of mine but others feel it worthy of inclusion…
The standard way of illustrating socio-economic data for countries on a world map would be a choropleth. Options, of course, exist, to show data in a different way including proportional symbols or cartograms. All of these techniques are perfectly reasonable but all suffer from one problem, namely that it’s up to the map reader to make visual comparisons between areas shaded differently or symbolised differently. The focus is on how one place compares to another. What if the question is based on trying to understand how similar or dissimilar neighbours are?
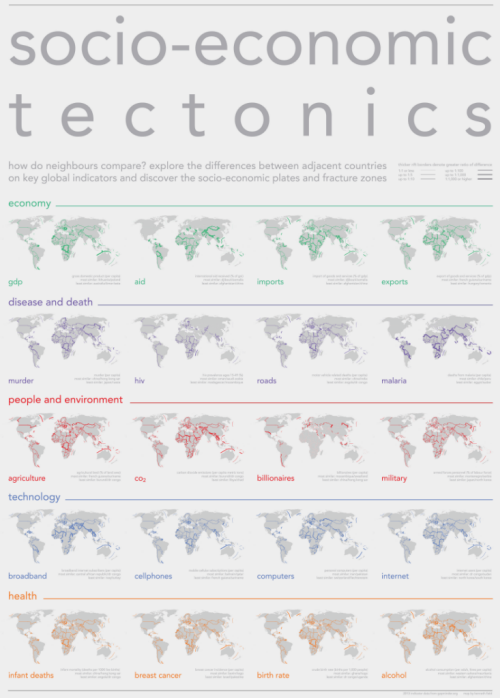
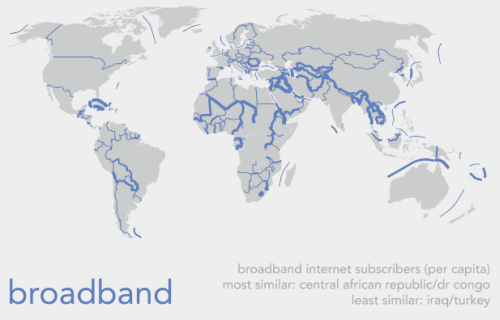
This map looks specifically at the relationship between bordering countries to create a set of proportional line symbols that represent their dissimilarity…let’s call it a proportional adjacency map (any better ideas?). It’s a sort of linear cartogram. Thinner lines mean countries share a very similar value for the variable. Thicker lines mean adjacent countries are very dissimilar. Additional ‘boundaries’ have been added to show how countries differ when they are separated by a stretch of sea or ocean.
The map shows twenty key socio-economic indicators, four for each of five broad themes. The use of small multiples gives a sense of how different countries vary across different measures. The only colour used on the map simply provides a motif for each of the five themes. Additionally, there is a note for each variable to express which two adjacent countries are most similar, and which are most dissimilar. The title is simply designed to capture attention and provide a metaphor for the socio-economic fracture zones that crisscross the planet.
The style of the map has been deliberately kept subdued so only the coloured fracture zones stand out. It demonstrates that if we’re trying to map a specific characteristic of data that isn’t well supported by conventional techniques then sometimes we have to make a new technique or modify one to suit our purposes. In many ways this map tehnique is the counter to a choropleth and literally fills in the gaps.
You can download a full size print version of the map here.


Pingback: Our Favorite Maps of the Year Cover Everything From Bayous to Bullet Trains | Nagg
Pingback: Indie Game Developer! | Our Favorite Maps of the Year Cover Everything From Bayous to Bullet Trains
Pingback: Our Favorite Maps of the Year Cover Everything From Bayous to Bullet Trains * The New World