
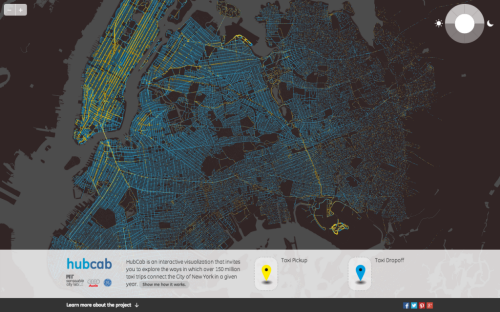
Interactive maps that invite you to explore a big dataset can be intriguing but all to often they fail simply because they are data dumps with little thought to the user needs. Here, the ways in which over 170 million taxi trips connect the City of New York in a given year is the data set. This map provides a unique insight into the inner workings of the city from the unique perspective of the taxi system with a high level of granularity.
HubCab allows users to investigate exactly how and when taxis pick up or drop off individuals and to identify zones of condensed pickup and dropoff activities. It allows you to navigate to the places where your taxi trips start and end and to discover how many other people in your area follow the same travel patterns.
The map can be used to allow an exploitation of collective mobility, patterns of sharing and the authors hope it might be the first step in building a more efficient and cheaper taxi service.
The cartography is clean with simple line work on a dark basemap but it’s the interaction and animations that are particularly well constructed. A good example of exploratory cartography to support exploitation of a large dataset.
Click the image to launch the web site and app.
