 If a map’s main intent is to communicate information through graphical form then they are, by definition an information graphic. Modern parlance has seen the rise (and over-use) of the term infographic which has become synonymous with dramatic, often abstract representations of data. They are often composed of a collection of linked graphs, punctuated by key words, phrases or numerical highlights…the better ones offer some sort of coherent whole that places an emphasis on a well structured layout. This is also the description of a map. Maps have always been infographics, long before someone invented the term…though in the same way that not all infographics are meaningful or well designed, so the same goes for maps. Maps that are abstract (or highly diagrammatic) might very well be seen as belonging to the new fashion for journalistic infographics more than more traditional styles.
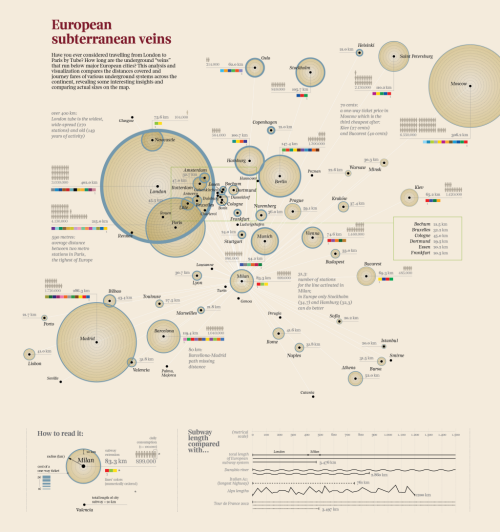
This example by Accurat is a terrific example of taking a single theme and developing a strong, abstract depiction of space through the organisation of a range of graphical elements. The shapes of land/water and any typical geographies are eschewed in favour of a mechanism that simply showcases the information. The structure of these components makes the geography implicit rather than the geography itself being used to organise the content.
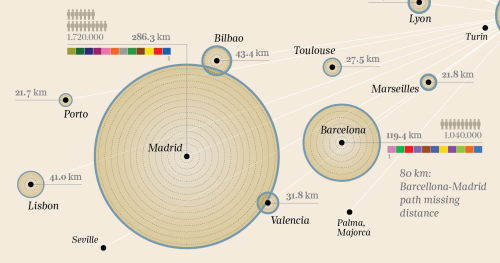
The map provides the reader with a fascinating exploration of the underground transport veins that traverse major European cities. The title is attractive and catchy. The layout is clear and well balanced. The colours are simple and do not compete with each other. The main elements – the proportionally scaled circles give an immediate sense of comparison and scale. There’s a wealth of information on the number of lines, the number of users, the cost, the length of extensions and the geographical reach of the system. The use of size is used to great effect in different ways to connotate magnitude. Colours show us difference. Small multiples illustrate number of users. Labels and textual components are used as a literal symbol to give us headline facts and figures. All classic visual variables, well executed. There’s an extremely subtle visual hierarchy also at work that organises textual components and shades of colour which together give us a sense of figure and ground as well as contrast.
The map itself is clean and well composed but the legend is also extremely well organised giving clear information with even the title ‘legend’ (one of the most pointless labels on any map) being replaced by the far more useful ‘how to read it:’. The graph shows us some comparisions with other distances – rivers, mountains, roads and the Tour de France route. Great comparisons that provide some additional perspective.
This is a very well constructed information graphic. It deals with data that is organised spatially and the spatial dimension affords us comparisons. It’s a map…in the same genre as those by Beck, Minard, Snow etc.


