Click the image to view the online map
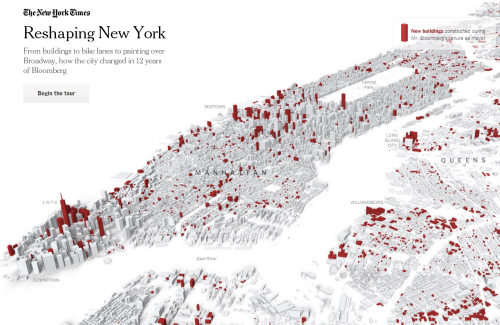
As part of a special series of articles exploring the mayoral legacy of Michael Bloomberg, The New York Times presented a map-based application that told the story of some of his more notable achievements and impact on the city of New York. Telling a story through maps isn’t novel but telling it through a responsive digital environment with clean, crisp graphics, a minimum of words and a narrative that allows the user to explore is an achievement. The New York Times are contemporary masters of digital map-based story-telling.
The application takes the form of a linear tour, opening with a clear statement ‘from buildings to bike lanes to painting over Broadway, how the city changed in 12 years of Bloomberg’. There’s a ‘begin tour’ button yet it doesn’t actually matter where you click to advance the story to the next page. This is a clever trick…no need for people to have to worry about hitting a particular point on the page…the page turns wherever you touch it…much like you can turn the page of a book pretty much anywhere on the page.
The maps include 3D renderings of the city’s buildings….simple grey blocks rather than detailed facades work because the skyline is uniquely familiar. Key buildings in the story are picked out in red – the only other hue used as a focal colour and there are subtle shadows and shading to add depth and structure to the image. It’s a nicely composed illustration with labels added with a semi-transparent knock-out mask as appropriate. Some clicks reveal (rapidly) an aerial photograph that contrasts well with the simple map rendering. These maintain the interest and help to illustrate the facts using real imagery that reinforces the reality. As you move through different topics, different colours are used to match different themes. Red for buildings. orange for rezoning, green for bike lanes. Three colours that we can easily recall when thinking about the topics in the story.
Between stories and scenes, the maps animate smoothly with an almost surreal fuzziness until they stop and come into focus. This is a great trick and allows us to pause while the map gets to where it’s going before the focus draws our attention back.


