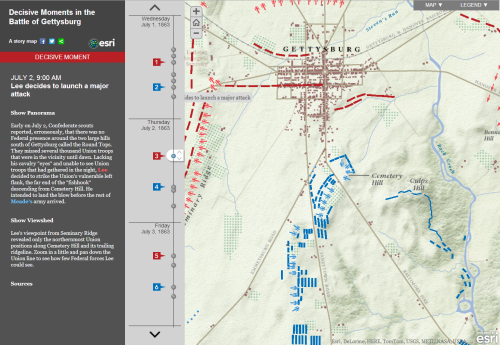
Click image to view the online web map
The use of preconfigured templates has become one way in which people can author their content as a web map and Esri’s Story maps team has developed a range of approaches that allow people to apply different design metaphors to their work depending on how they would like readers to interact. Here, the Battle of Gettysburg uses a modified template to use the screen in different but complementary ways. The map takes up the main area and is populated by a textured basemap with light colours to act as a background. The highly saturated symbols sitting atop work well by contrast. A timeline down the central area allows people to navigate to key events which are then described in the vertical panel to the left.
Content is rich and immersive and combines a range of media including animated point-of-view panoramas. The links between the panels are clear and unambiguous and there are sensible hover events that provided added context when exploring the map. The marginalia are hidden until opened and there is the ability to switch the map for a satellite view to see the area as it exists today. A simple and effective interface to tell the story of the battle.