
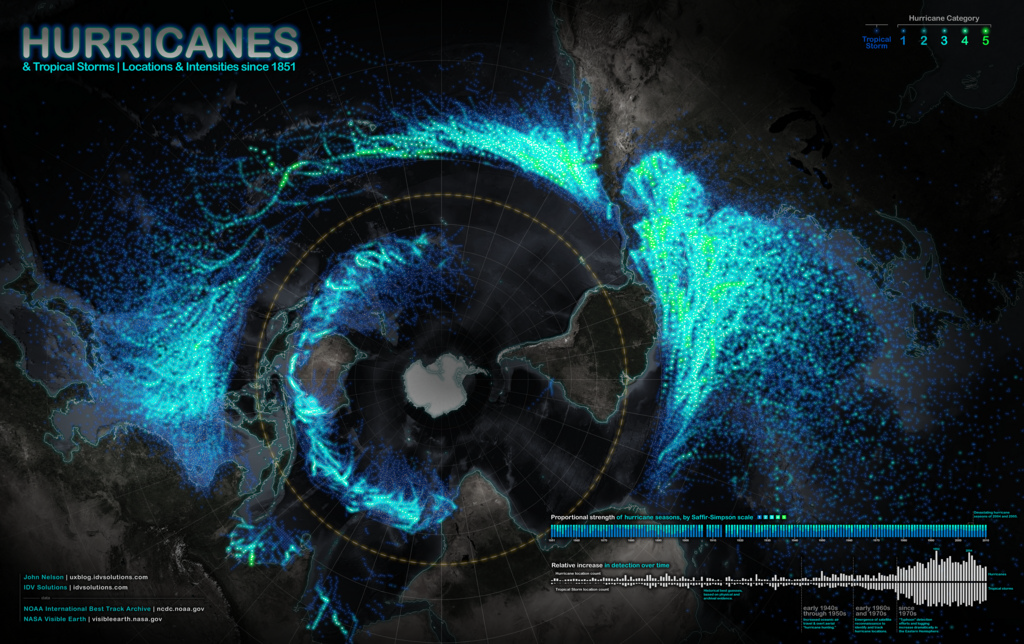
A stunning poster format print map of all known Hurricanes and tropical storms since 1851 from the NOAA archive. As the availability of archived geolocated datasets continue to grow, many are experimenting with different ways to map the detail. John Nelson’s maps are visually strong as he creates high contrast between the map elements. Here, he uses a basemap that is almost faded completely into a black background. The familiar image of Antarctica acts as a good visual anchor that allows people to orientate themselves to the unfamiliar polar stereographic projection. Mapped onto this projection, the storm paths produce a fantastic swirling ring around the map – a pattern that wouldn’t be nearly as dramatic if he’d used an alternative projection.
Nelson uses almost neon colours for the hurricanes tracks and differentiates by intensity using size and colour. He also applies a fair bit of Gaussian blur to create a soft focus on many of the map elements to great effect which creates a unique style. On a dark background, Nelson’s map shows how the normal connotation of dark = more is reversed as light = more and sits higher in visual perception. Useful graphs and other peripheral information is illustrated succinctly around the well balanced map.
This is one of a number of similarly styled maps which can be seen and also printed on Nelson’s website.
