
Click image to view the online web map
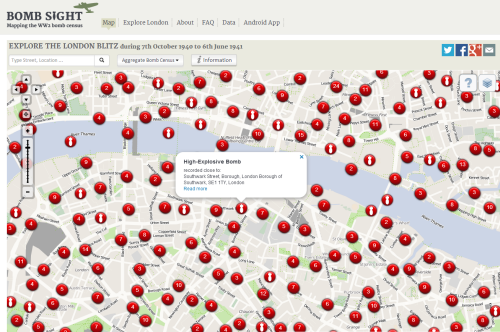
This web map presents the London WWII bomb census between 7.10.1940 and 6.6.1941. It’s a terrific effort that catalogues anti-invasions sites, bomb types and adding an overlay of the bomb maps themselves. The map is the result of a year’s worth of work which hints at the effort needed to build an interactive web map with good quality content.
Zoomed out to a scale of 1:72,000 or smaller the map of London becomes awash with red symbols which ordinarily would be considered the antithesis of how to depict multiple overlaying features. Yet here, the result is to visually demonstrate the extent of the blitz and it’s visual impact is stunning. Zooming to a slightly larger scale and you can pick out individual strafing attacks and the impact of lines of bombs. When you zoom in further the symbols begin to separate and change into ones which portray individual bombs that can be interrogated.
Filters, graphs, search, statistics and ancillary information make this a well produced piece of work and if you view on a mobile device there’s a great augmented reality version that means you can view through your mobile phones camera with an overlay of bomb details as you wander around London.
Great example of a portal to historical information through a web map.
