MapCarte 334/365: 2012 Presidential election by Chris Howard, 2012

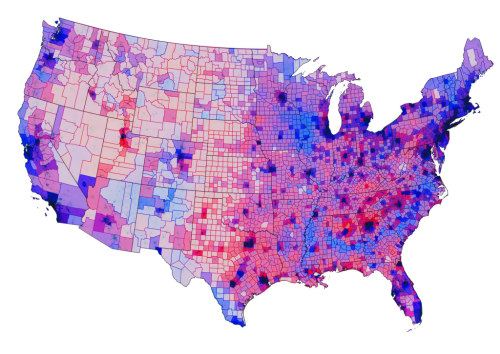
MapCarte334_howardThe choropleth technique is a standard thematic mapping approach which is flexible and relatively easily understood by map readers. The principle is simple…where enumeration areas have a greater relative magnitude, they get shaded darker and vice versa. There’s some simple design rules for choropleths such as ensuring you’re using normalized data, that is, data that equalizes for population or some other denominator which is important to ensure we see areas symbolized properly in relation to others. It’s also important to set up the shading scheme with colours that connotate some quantifiable difference between areas. We naturally see shades of any hue in this way (e.g. light to dark red or light to dark blue). That’s not to say we can’t get a little creative with the choropleth which is what Chris Howard has done here with his map of the 2012 Presidential election result in the USA.

Howard uses a diverging colour scheme with a mid purple where the Democrats and Republican’s shared a pretty even vote. The colour moves towards a strong blue for areas that have a strong Democrat share and to red for a strong Republican share. This is a standard approach where you have a dataset that tends around some mean, average or key value. He goes further though and creates a version of the value-by-alpha technique created by Roth, Woodruff and Johnson. The original value-by alpha technique assumed a black background and the general idea is to use a layer of transparency across the top of the standard choropleth that modifies what we see according to a second piece of information. For the results of the election, transparency is used to encode the population density. The alpha layer is highly transparent where the population density is highest, and near black where it’s at its lowest. This has the effect of highlighting the areas that have more voters. Howard has simply created a version against a white background with increasing white added to the alpha layer where there are lower population densities. We therefore see a set of muted colours that decrease their importance in visual perception…in line with the very nature of such areas in voting terms. Fewer people just don’t contribute as many votes.

It creates a beautiful map with a wide range of colours but one that is perfectly understandable. Howard also goes further by adding a layer of populated places that sits in the map and just gives a subtle highlight to the major cities, helping them stand out a little. He also changes the colour of the County borders to either a red or blue to show the predominant vote in that area.

Choropleths can seem rather boring despite their utility. By thinking a little about how you might be able to develop the visual message you can end up with some very attractive thematic maps that invite perhaps a little more interest.

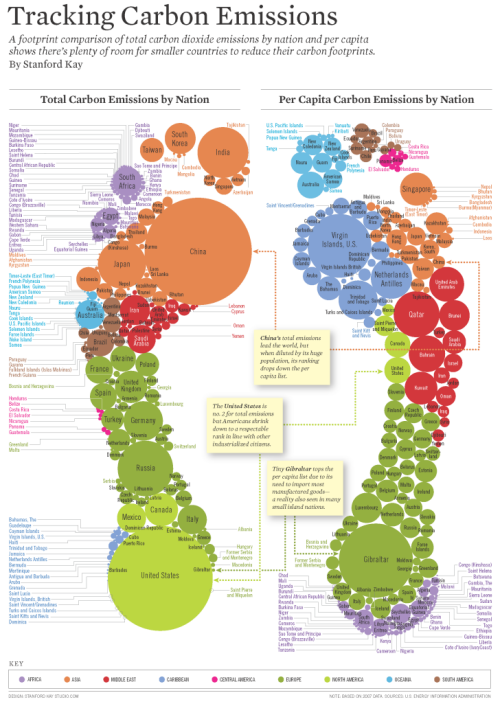
MapCarte 238/365: Tracking Carbon Emissions by Stanford Kay, 2011

MapCarte238_carbon


Maps don’t have to look like maps though the further they veer from what we see as a traditional conceptualisation of space, the more people think of them in a different way. Terms such as diagram or infographic are commonly applied to maps that people don’t feel are worthy of the title ‘map’. Even Beck’s fantastic map of the London Underground polarises opinion with as many considering it a diagram.

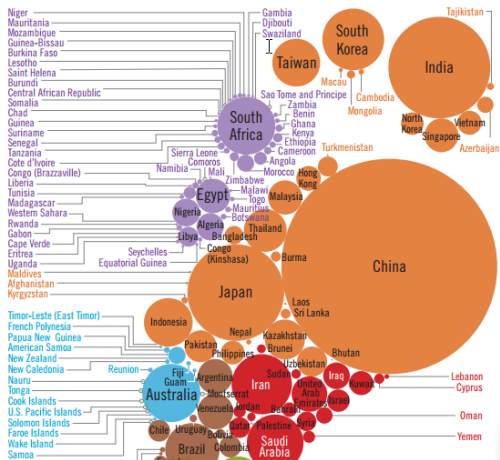
Stanford Kay’s effort in mapping carbon emissions almost certainly fits this mould. The metaphor is immediate as the shape of two footprints is a wonderful way of exploring the cost of our carbon footprint. The feet are made up of proportional circles showing the amount of carbon dioxide emissions per country. It’s a Dorling cartogram but it’s not entirely devoid of spatiality. The symbols are organised into broad regional areas so you get a sense of how different contries compare on a regional basis by simply recognising the colours. International comparison comes through exploring the different sized symbols and their labels.

MapCarte238_carbon_detailCertainly this is at the heavily stylized end of the cartographic spectrum but it maps data represented spatially. The left foot shows us totals and the right foot reorganises the data per capita so we get two feet, each of which shows us a different aspect. Text is fairly limited but a nice touch is the linking of the countries labelled in list form with the symbols of the circles themselves.

The traditional shape of the outlines of projected countries gives way to a more powerful aesthetic. It’s a beautifully organised piece of work.We shouldn’t be afraid to make maps that use strong visual metaphors.


MapCarte 237/365: Carte figurative des pertes successives en hommes de l’Armée Française dans la campagne de Russie 1812-1813 by Charles Minard, 1869

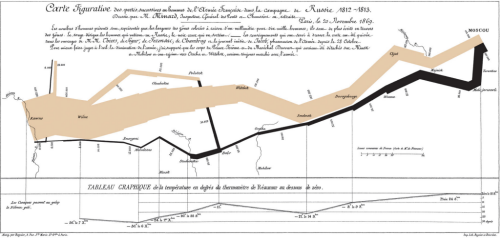
MapCarte237_minardAs it is colloquially known, he Minard map was published in 1869 on the subject of Napoleon’s disastrous Russian campaign of 1812. French civil engineer Charles Joseph Minard’s maps and graphics are often cited among the best in information design and this is perhaps the most famous of his works.

The schematic flow approach of this statistical graphic, which is also a map, displays 6 separate variables in a single two-dimensional image: geography, time, temperature, the course and direction of the army’s movement, and the number of troops remaining.  The map has been described as one of the most complete statistical maps of all time by Edward Tufte and it’s rare to find a list of classic maps that argues with this commendation.

It is superbly clear in its representation using only two colours with black emphasizing the death toll on the retreat.  The horrific human cost is the story of the map as Napoleon entered Russia with 442,000 men and returned with barely 10,000 which included some 6,000 that had rejoined from the north, symbolized as 1mm of line width to 10,000 men.  The geography of the battles are marked and the temperature shown across the bottom supports interpretation.

Napoleon underestimated the vastness of Russia and the inhospitable winters.  Minard exquisitely mapped the total disaster.

MapCarte 121/365: Wahlland by Moritz Stefaner, 2013

MapCarte121_election

Click the image to view the online web map

Following the mapping of elections has become almost as much of a spectacle as the elections themselves. Media outlets seem to fall over themselves trying to provide more detailed and expansive coverage than their rivals. Over the course of the last decade we’ve seen countless ways to map the detailed voting patterns as they are announced and the map takes shape. Proportional symbols, choropleths, a variety of cartograms and three-dimensional techniques have all been used in recent years.The map presented here hasn’t been widely used and takes a different graphical approach altogether.

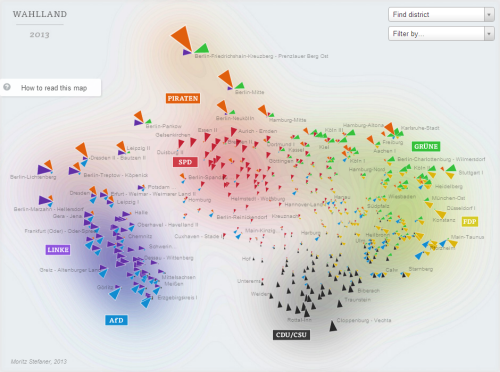
Made as a web map and published by the online arm of German newspaper Die Zeit (The Times), the Wahlland map shows the Germand Bundestag elections of 2013. The electoral districts of Germany are arranged by their voting behaviour using a very abstract approach that is based on similarity of lifestyle, preference and attitude rather than geography. Each district is represented by a series of triangles arranged almost like a coxcomb chart over each district. Each segment maps the results (by size) for the party represented (by colour). Rather than simply mapping voter numbers the size maps the relative difference to the average result of that party overall. Only parties that are above average are mapped and the districts are arranged so that more similar districts are clustered. It’s a novel approach to mapping multivariate statistical data that shows not only the salient information of the results but in a way that adds value and provides some sense of the underlying geography and patterns being revealed. Which districts voted like each other? Are they geographically proximal or distant?

The design goes beyond by providing a very helpful legend (hidden until required) and also allows data to be seen through hovering over each segment. The map can be filtered by state or by party so the clusters are easily viewed and the subtle background shading works to anchor the eye to a cluster and give a hint as to the overall quantity of vote for a party. Geography is thrown to the wind but this is a novel and well crafted alternative to more traditional forms of mapping elections that is visually eye-catching and performs well. Even the way it draws is neat, smooth and easy on the eye.