And so to the final map of this year’s blog. 365 entries which form a solid exploration of cartographic design using classic and contemporary examples of the art, science, technology and craft of cartography. And the final map is…not a map. It’s the following description:
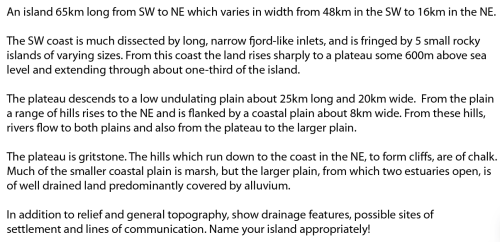 Mental mapping is a natural part of our everyday lives. The maps we form in our own mind help us make sense of the world, picture places and support our navigation. While there is plenty of research to support the notion that modern technology is eroding our spatial cognition, the ability to define our own unseen cartographies remains key to understanding space and place. Our own mental maps are informed by a multitude of factors including education, experience, likes, dislikes, aspirations and desires. Classic studies show us that who we are and where we live play a big part in establishing our own personal spatial order. Our own knowledge allows us to, for instance, draw maps that more closely relate to reality compared to our abilities when imagining unknown places. Mental maps are not devoid of design either. We picture our maps in a variety of ways from simple black and white line drawings to fanciful worlds.
This MapCarte entry is a personal thank you to one of my former mentors, Roger Anson. Roger was Principal Lecturer in Cartography at Oxford Polytechnic. He was the boss and along with his colleagues in the late 1980s and early 90s they taught me all they knew about cartography (and a lot about beer as well – but that’s a different story). As students,one of the earliest practicals we were asked to complete involved the passage of text you see above. I’ve kept it and used it with my own students over the years. It’s a simple description of a place. The task involved drawing this place; building a mental image and then translating it to paper. It was a wonderful exercise in exploring the difficulties of imagining and describing places using words and the importance of maps as ways of seeing and representing space and place.
Unwittingly, we were being taught the importance of mental mapping and learning how to better create a spatial framework in our own minds. The development of our mental mapping capabilities was as important as our abilities to simply make maps using pens or computers. We first had to imagine them. The tools and the buttonology was secondary. They were merely the mechanisms by which we translated what we saw in our mind to a useful tangible product. It’s a principle that still serves well today.
So what of the map that the text describes? Can you imagine what the map looks like? Can you draw the map? Is it a real place or something abstract?
Well, below is my hand drawn effort from all those years ago (yes, I keep everything!).
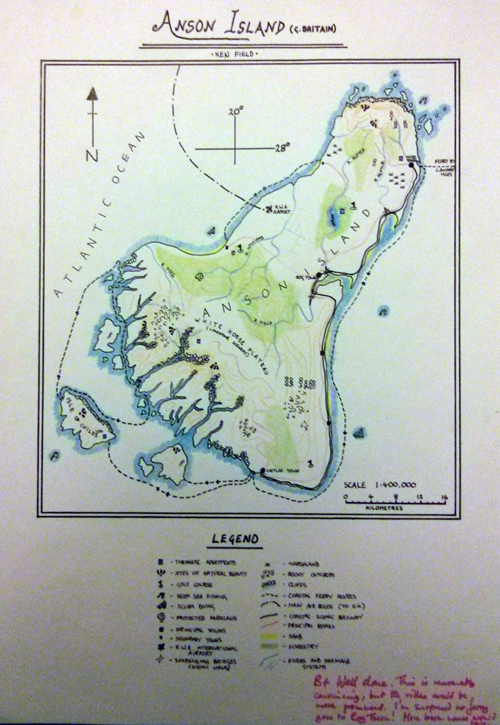 I called the place Anson Island. Can you tell what it is? As Roger said himself in the grading…it’s ‘reasonably convincing’ though when I quickly re-drew the map some years later to show my own students what they were ‘seeing’ (including copious Snowpake!) the map becomes somewhat more obvious in general structure:
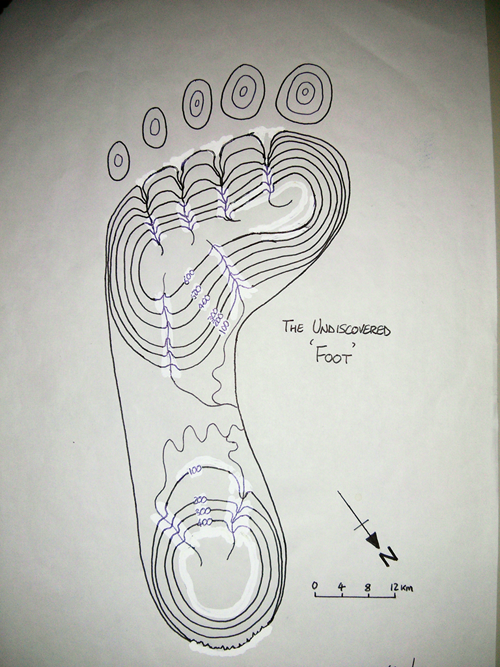 For some reason that I cannot recall I re-named the island ‘The Undiscovered Foot’. Reading the description back, the answer seems obvious and once seen it’s almost impossible not to ‘see’ the foot in the original passage. But it didn’t at first.
The beauty of mental mapping means it’s neither right nor wrong…it’s one interpretation. There are others! If you follow the basic structure of the description you’ll arrive at, well, a drawing of a footprint or something a little more fanciful like my original effort. Post-exercise we were told by Roger that he got out of the bath one day and stepped onto the bathroom floor whereupon his wet foot made an imprint. He imagined the wet puddle as a map and began describing the puddle as an imaginary island, or set of islands. Where there was more water, he imagined mountains.
It makes for a fantastic exercise to create a fictional topography that shares the same basic structure of a footprint. Of course, many of our maps didn’t look anything like footprints (mine only bears a passing resemblance)…because by the time you’d realized what it was you were drawing you’d already spent a considerable time and you weren’t allowed to start the exercise again. This also taught us the value of time in the cartographic design process…thinking is important. Our use of computers and reliance on defaults tends to bypass that thinking phase for many these days but thinking about your design and sketching it out remains important.
I thought I’d bring my effort up-to-date so here’s a 2014 version which I’ve reverted back to it’s rightful title of ‘Anson Island’. Perhaps interestingly the original version took me possibly a couple of days. This version took me about an hour.
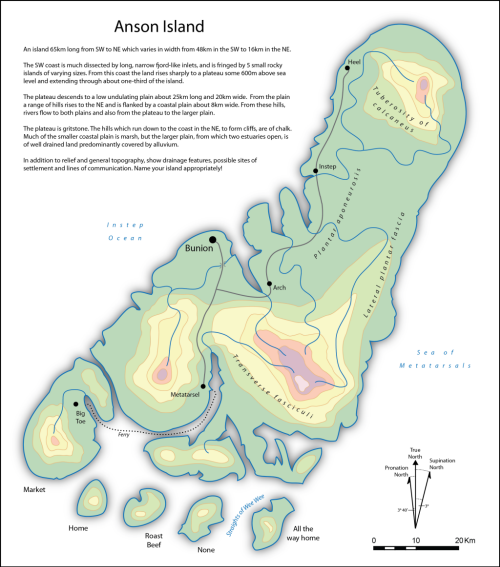 We are all mental mappers in the sense that we can all imagine geographies and we translate spatial understanding into pictures using mental cartographies. We design our own maps and they all look different. One other outcome of this exercise has led to a phrase I often come back to…apart from when one makes a constructional error, in map design there’s often no such thing as a correct map and an incorrect map; there’s simply better maps and poorer maps. Following the basic principles of cartographic design gets you some of the way to producing a well formed map. Beyond that, you need a little imagination, a little flair and an ability to bring something innovative and inspiring to your work.
You also need great tutors and Roger and his colleagues inspired me, taught me and nurtured me. This final MapCarte is a dedication to all those great cartography tutors out there who give us the basic cartographic design principles upon which we build our maps. Beyond that, we all bring our own design philosophy, style and influences to our work.
Maps exist in all of us. Some of them turn out to be great, some not so great; but they are all designed in some fashion and all add to the wonderful world of maps.

