
 It seems almost inconceivable that we once lived in a time where mapping abstract geometries, overlaying hundreds, if not thousands of features and applying a huge dose of transparency wasn’t mainstream. Yet it was only four years ago that Paul Butler suggested that “visualizing data is like photography. Instead of starting with a blank canvas, you manipulate the lens to present the data from a certain angle.”
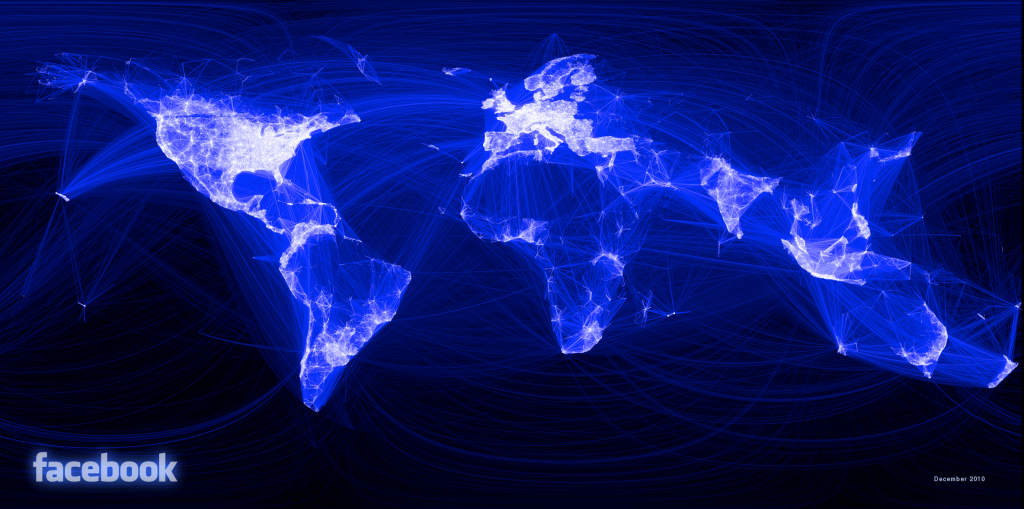
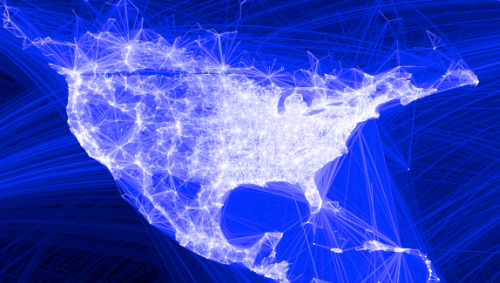
His social graph of 500 million facebook users cleverly demonstrates this philosophy. He asks “what might the locality of friendship look like between users of facebook” and takes the links between facebook user’s location and the location of their friends, plots a black-blue-white great circle arc between them and the result is a detailed map of the world. There are no other geographical datasets yet the shapes of continents, locations of cities and some international boundaries emerge. The map is made entirely out of human relationships and the geometries that represent them. He takes the approach of an airline route map yet applies it to other, more ephemeral connections.
The black background contrasts well with the almost fluorescent lines to create a fiber-optic appearance that lights up the globe. The long distance curves contrast well with the shorter, almost straight, lines of local connections to create an intriguing spider-web pattern. The facebook logo is so widely known that the map needs no other data or contextual information to enable us to make sense of the theme or patterns.
This sort of map has become commonplace; almost boring as people replicate the technique with a multitude of abstract datasets. It obviates the need for a reference basemap to ground the thematics but if you’ve got enough data then the structure of the familiar is seen. You need no other geographies.