MapCarte 286/365: Kii – Kinki 360° panorama map by Masaki Oda, 2009

MapCarte286_kinki

Japanese cartography is renowned for the quality and craftsmanship of their panoramas. The detail is exquisite and the scenes are so well framed with not only landscape but, often, a narrative of and contained within the vista itself. This beautiful example from the studio gTonbi-eye by Masadi Oda is in a full 360 degree perspective and depicts the landscape of the Kii peninsula near the centre of the Japanese islands.

As an area that receives large annual rainfall measures there is a lot of dense natural forest so the image is predominantly green though there are diverse landscapes revealed with plains, mountains and basins on view.

MapCarte286_kinki_detail1

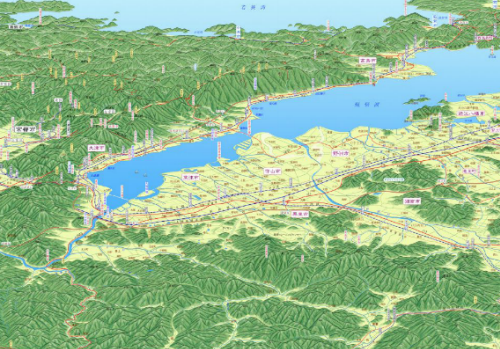
To the north is the city of Kyoto but the impressive design characteristic of this work is the combination of such a macro-level image but which also allows the reader to view the micro detail of different urban or rural regions. Creating a map that supports these tow very different scales and views is impressive. The maps are made by hand which makes their design all the richer since every stroke has been thought through and carefully applied. There’s no analytical work involved to apply equal treatments across similar data types which has the result of making each component just that bit different.

MapCarte286_kinki_detail2

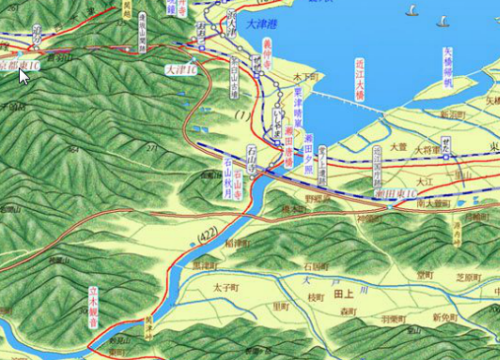
The mountainscapes are shown predominantly as aspect molehills but with a carefully applied hillshade to give added depth. The outlining of each mountain ridge in a darker colour wouldn’t be seen naturally but gives each mountain a presence and clarifies the image. At over 3 metres in length if you wrapped the map around you and stood in the centre you would genuinely see the landscape.

MapCarte286_kinki_detail3
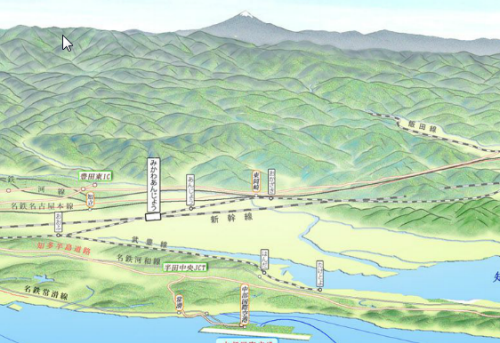
Finally, the author has added some realistic haze effects so that distant features seem subdued in comparison to the foreground. Our eyes are naturally accustomed to this in the real world and the map mimics it and makes the reader feel at ease. Even Mt Fuji makes a distant appearance in the distant haze.

Rich in detail, colour and thinking.


MapCarte 78/365: Atlantic Ocean Floor by Heinrich Berann, 1968

MapCarte76_berannIn 1967, Austrian landscape panoramist and cartographer Heinrich Berann painted the first in a series of plan oblique physiographic maps of the ocean floor which ultimately culminated in the 1977 World Ocean Floor map for Columbia University and the U.S. Navy. He worked in collaboration with pioneering oceanographers Bruce Heezen and his assistant Mary Tharp and together they revolutionized the theories of plate tectonics and continental drift. The individual maps were printed by National Geographic (this from 1968) and labels added using the familiar yet unobtrusive NatGeo typeface.

Berann skillfully combined blue-greys to create a topologicallly accurate, though hugely exaggerated, picture of the ocean floor that leads readers to want to explore.  The Mid-Atlantic Ridge and fracture zones appear so life-like with a rippling effect and intricate detail that it draws your eye in and captures your attention.  This creates a strong figural component positioned central to the map page that suggests the page (and fracture zone itself) splitting down the middle. The yellow land and deep grey-blue ocean floor provides a strong contrast between land, shoreline and oceans.

MapCarte76_berann_detail

This map is also testament to the outcome of strong collaborations. Berann knew little of the sea floor topography but worked alongside domain experts whose knowledge was key to the end product. This is a lesson for all map-makers in that their designs should be based on sound data, detail and judgement. Cartographers are good at cartography. More often than not bringing in expertise gives the work authority. Of course, the counter is also true and many domain experts could use a good cartographer.

More of Berann’s work can be seen at his web site here.

MapCarte 63/365: The Peak Leisure Club by Zaha Hadid Architects, 1982

MapCarte63_hadid

Doing something different is often a good way to bring attention to your design. Here, as a competition entry to design a proposal for an architectural landmark to stand apart from the congestion and intensity of Hong Kong, Zaha Hadid chose to veer away from the familiar approach of traditional elevations and axonometric projections.

The crucial element in her map was to place the water’s edge at approximately 30 degrees to the horizontal and present the buildings as almost vertical in the image. If you rotate the image so that the water and land are horizontal then, of course, the buildings make no sense. To emphasise the architecture and the man-made landscape (i.e. to focus on her design for the landmark buildings), she warped the terrain. This gives focus, but more so, a sense of drama and ‘difference’ because it’s not how we might expect to see Hong Kong harbour. The map reader’s interest is immediate and the challenge of seeing the landscape presented in this way creates interest.

The building design itself was described as ‘suprematist geology’ and required considerable excavation of bedrock. Because of this, the map here was intended to reflect the unique, modern appearance as both integral to the surrounding geology hence similar colours and shades are used for both the landscape and buildings. The club building was intended to represent the ‘high life’ so presenting the map in portrait, squeezing the image width and exaggerating height of the buildings also helped bring that sense of aspiration.