
Click the image to view the online web map
Following the mapping of elections has become almost as much of a spectacle as the elections themselves. Media outlets seem to fall over themselves trying to provide more detailed and expansive coverage than their rivals. Over the course of the last decade we’ve seen countless ways to map the detailed voting patterns as they are announced and the map takes shape. Proportional symbols, choropleths, a variety of cartograms and three-dimensional techniques have all been used in recent years.The map presented here hasn’t been widely used and takes a different graphical approach altogether.
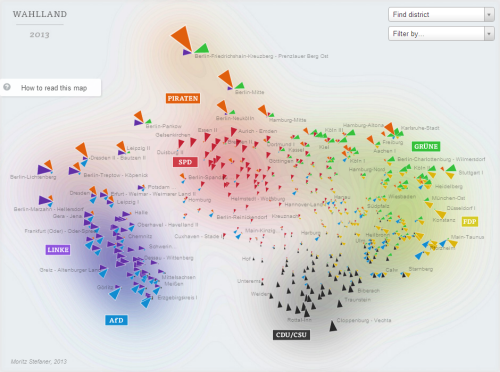
Made as a web map and published by the online arm of German newspaper Die Zeit (The Times), the Wahlland map shows the Germand Bundestag elections of 2013. The electoral districts of Germany are arranged by their voting behaviour using a very abstract approach that is based on similarity of lifestyle, preference and attitude rather than geography. Each district is represented by a series of triangles arranged almost like a coxcomb chart over each district. Each segment maps the results (by size) for the party represented (by colour). Rather than simply mapping voter numbers the size maps the relative difference to the average result of that party overall. Only parties that are above average are mapped and the districts are arranged so that more similar districts are clustered. It’s a novel approach to mapping multivariate statistical data that shows not only the salient information of the results but in a way that adds value and provides some sense of the underlying geography and patterns being revealed. Which districts voted like each other? Are they geographically proximal or distant?
The design goes beyond by providing a very helpful legend (hidden until required) and also allows data to be seen through hovering over each segment. The map can be filtered by state or by party so the clusters are easily viewed and the subtle background shading works to anchor the eye to a cluster and give a hint as to the overall quantity of vote for a party. Geography is thrown to the wind but this is a novel and well crafted alternative to more traditional forms of mapping elections that is visually eye-catching and performs well. Even the way it draws is neat, smooth and easy on the eye.