

Click the image to view the online story and maps
It’s quite possible that with every new story the New York Times graphics department do their utmost to out-do even themselves. Their maps have already featured in MapCarte and at the half-way point it’s a fair bet that one of the remaining 182 posts will feature their work.
This example illustrates how to combine a range of illustrative media into a coherent story. Their isn’t a single map or image, technique or dataset that would convey the story in a singel pane or a few web pages. The solution is a scrolling page that reveals new insights as you progress through the imagery and text.
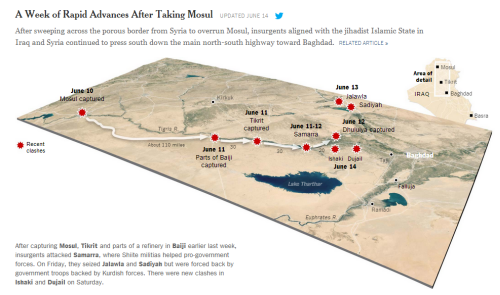
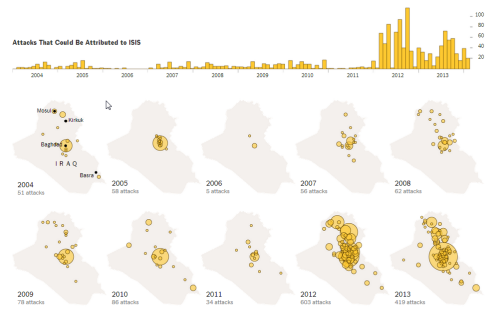
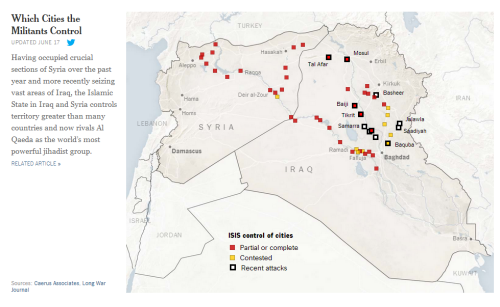
The maps are not complex. In fact, they are relatively simple affairs yet simplicity is often the key to communication. Each is used to tell a specific dimension of the story and they expertly mix topographic diagrams with small multiples, point of interest maps with satellite imagery.
The selection of just the right map type with just the right amount of detail is what makes this example of web-based reporting (story-telling?) so compelling. You want to scroll and learn more. You are encouraged through the work to want to explore and to have them reveal more.
Perhaps the most exquisite aspect of this example of cartographic storytelling is that the maps are web-based yet they are static. There is simply no need for interaction, click events, popups or animations. Simple, static maps that are individually balanced and well designed but collectively present a rich visual narrative. A good lesson in cartographic restraint.

Pingback: Data Viz News [61] - sqoops